Process Analyzer Properties
Highlight increased occurrences
The mpmX Process Analyzer allows fine-grained configuration of the representation of the process to be analyzed.
Nodes or activities can use the colour-coded circle in the middle of the activity symbol to represent the average activity duration or the frequency of this activity.
The same applies to the edges. The frequency of the occurring process edge or the average waiting time between two process steps can be displayed in the form of the thickness of the line.
Data Dialog
In order for the extension to run, the following dimensions and key figures must be configured in the Data dialog:
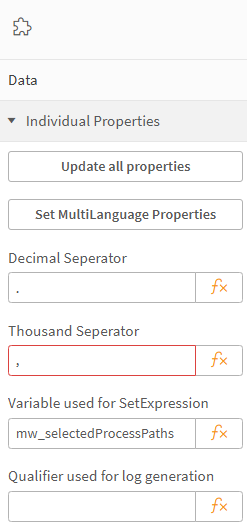
Individual Properties
- Variable used for SetExpression:
- Variable for restricting the displayed process variants.
- Default setting:
mw_selectedProcessPaths. - If an alternative state is set in the extension, a new variable must be created for it.
- Qualifier used for log generation:
- Default setting: empty
- If multiple event logs are used, this field can be filled with a value to have, for example, a process analyzer that can toggle between views such as Production Steps vs. Machines. For more information on how to do this check the page "Different Logs in one Application"
Click the Update all properties button after each change.
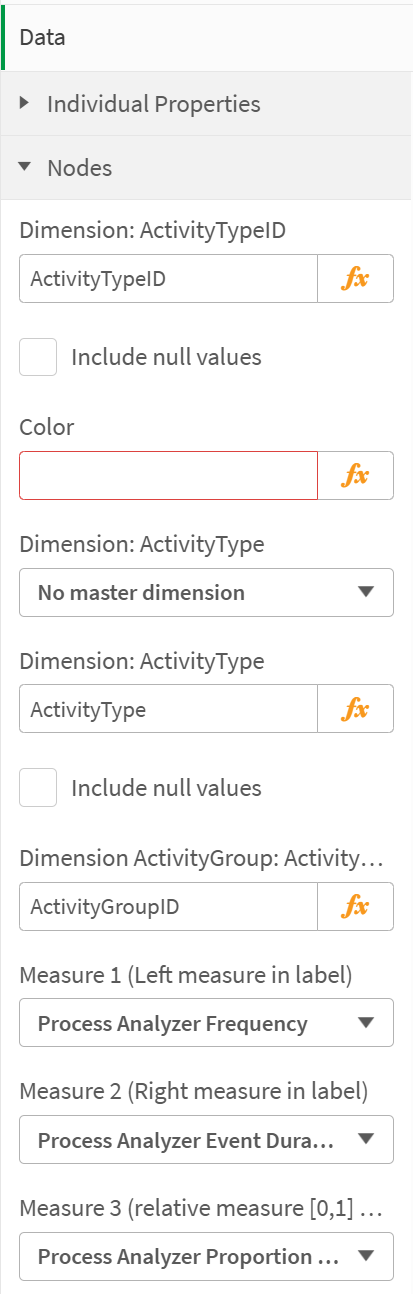
Nodes
- Nodes are also called Activities (in the process overall) or Events (in a specific case)
- Learn how to change the measures on the nodes
Node: Color
- Choose the color by dimension value (hex values, e.g., #bca670) which should be linked to ActivityType
- Learn how to change the color of events or activities:
Node: Dimensions
- Dimension:
ActivityTypeID: ID of the event - Dimension:
ActivityType: Description of the event - Dimension:
ActivityGroupID: ID of the group
Node: MasterDimension
- Only master items with the tag ProcessAnalyzer are in the options list. This is for a better overview
- You can select a master item as the definition. Otherwise, you can use the fixed fields to define custom dimensions/measures.
- Default setting: No master dimension is selected.
Node: Key figures in default
- Measure 1: Frequency of occurrence of the events; displayed in the node label on the left side
- Measure 2: Average processing time of the event; displayed in the node label on the right side
- Measure 3: % of cases with activities, displayed in the donut chart of the event (should be a relative key figure between 0 and 1)
Edges
- Color by dimension value (hex values, e.g., #bca670). which should be linked to the
EdgeID - Learn how to change the color of events or activities
Edge: Dimensions
- Dimension:
EdgeID: ID of the edge
Edge: MasterMeasure
- Only master items with the tag ProcessAnalyzer are in the options list. This is for a better overview
- You can select a master item as the definition. Otherwise, you can use the fixed fields to define custom measures
Edge: Key figures in default
- Measure 1: Frequency of occurrence of the edge
- Measure 2: Average waiting time between two events
- Measure 3: % of cases
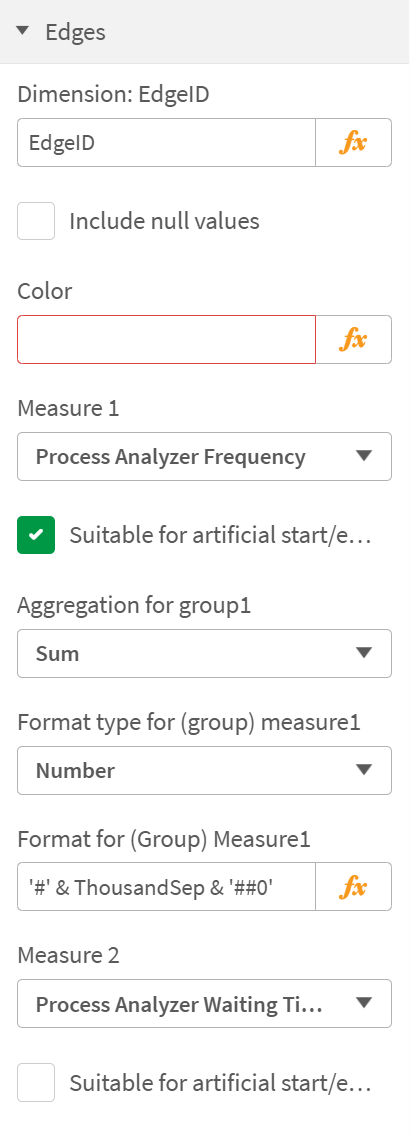
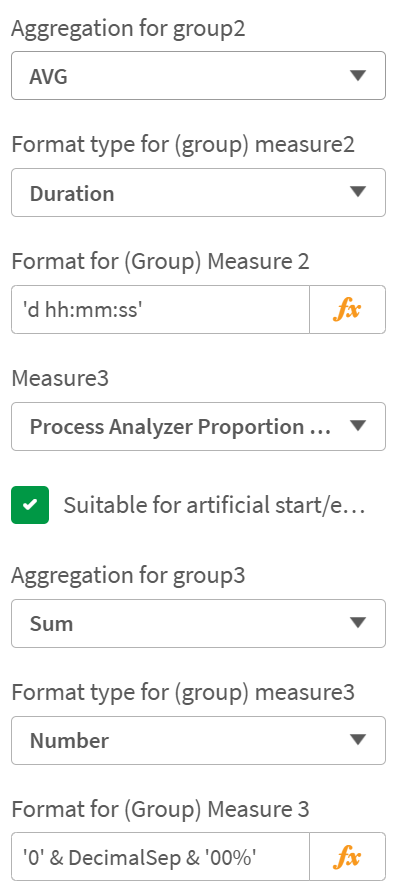
Configure in- and outgoing edges for groups
- Decide which type of aggregation should be used for edges that are collapsed in one in- or outgoing edge for a group
- Select the format type for edge measures when group nodes are shown
- Provide the format that is used for the calculation of edge measures when groups are shown


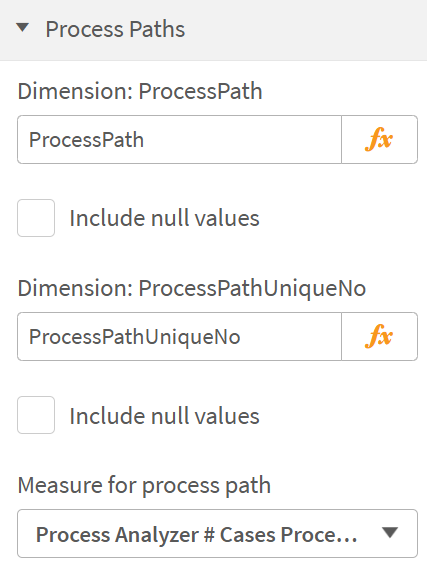
Process Paths
Path: Dimensions
- Dimension:
ProcessPath: Process variant - Dimension:
ProcessPathUniqueNo: ID of the process variant
Path: Key figures in default
- Measure for process path: Frequency of occurrence of the process variant
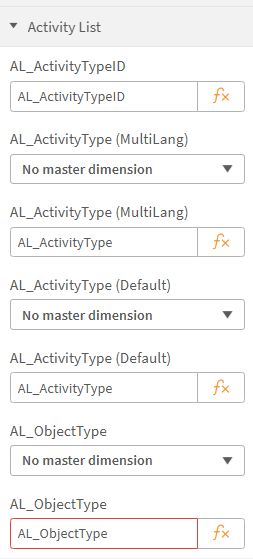
Activity List
- Required for the ProcessModeler
- AL_ActivityTypeID:
- ID of the activity/event which is generated as a list in the mpmX Engine
- Default setting:
AL_ActivityTypeID
MasterDimension
- Only master items with the tag ProcessAnalyzer are in the options list. This is for a better overview
- You can select a master item as the definition. Otherwise, you can use the fixed fields to define custom dimensions.
- Default setting: No master dimension is selected.
AL_ActivityType (MultiLang)/AL_ActivityType (Default)
- Description of the activtiy/event which is generated as a list in the mpmX Engine
- Default setting:
AL_ActivityType
AL_ObjectType
- Specification of the ObjectTypes which are generated as a list in the mpmX Engine
- Default setting:
AL_ObjectType
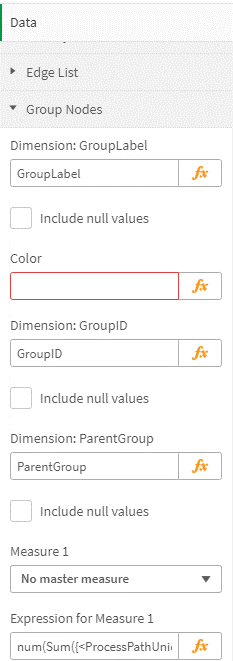
Edge List
- Required for the ProcessModeler
- EL_EdgeID:
- ID of the edge which is generated as a list in the mpmX Engine
- Default setting:
EL_EdgeID

Group Nodes
Group Nodes: Color
- Color by dimension value (hex values, e.g., #bca670) which should be linked to the EdgeID
- How to change the color for events
Group Nodes: Dimensions
- Dimension: GroupLabel: Name of group
- Dimension: GroupID: ID of group
- Dimension: ParentGroup: ID of parent group
Group Nodes: MasterMeasure
- Only master items with the tag ProcessAnalyzer are in the options list. This is for a better overview.
- You can select a master item as the definition. Otherwise, you can use the fixed fields to define custom measures.
- Default setting: No master measure is selected
Group Nodes: Key figures in default
- Measure 1: Sum of activity frequency of all activities within the group
- Measure 2: % Proportion of cases that include at least some of the activities from the group
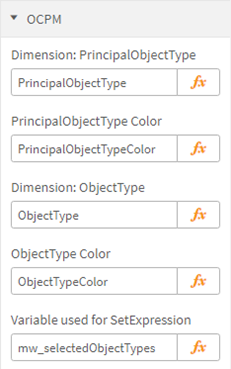
OCPM
OCPM: Dimensions
- PrincipalObjectType: The leading object type of an activity (if it has multiple ones)
- PrincipalObjectTypeColor: The assigned color for principal object types
- ObjectType: The object type of an activity, according to the executing case object type
- ObjectTypeColor: The assigned color for object types
OCPM: Variable used for Set Expression
mw_selectedObjectTypes: The object types that are shown in the Process Analyzer are stored in this variable
Appearance Dialog
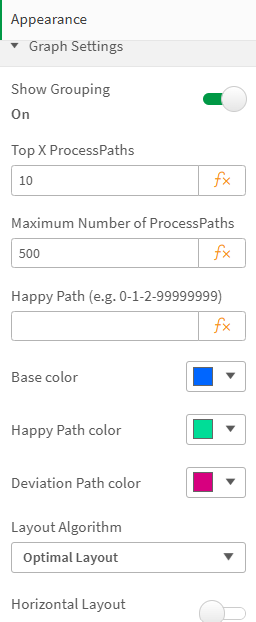
Graph Settings
In addition to the settings for the dimensions and key figures, the layout of the graph can also be adjusted in the Appearance dialog:
- Show Grouping: Toggle to turn grouping on/off
- Top X ProcessPaths: The assignment of the Top X button in the control bar
- Maximum Number of ProcessPaths: Limitation of the ProcessPaths displayed in the Process Analyzer (should not be set too high for performance and layout reasons).
- Happy Path: A Happy Path can be entered directly in this field. Alternatively, the field is filled by the ProcessModeler or it remains empty
- Base color: Influences the default color of nodes, edges and labels (including fill levels)
- Happy Path color: Defines the color of the Happy Path
- Deviation Path color: Defines the color of deviations from the Happy Path
- Layout Algorithm: Choose the layout algorithm that fits your need best (performance vs. optimal layout)
- Horizontal Layout: Choose between Horizontal or Vertical Layout.
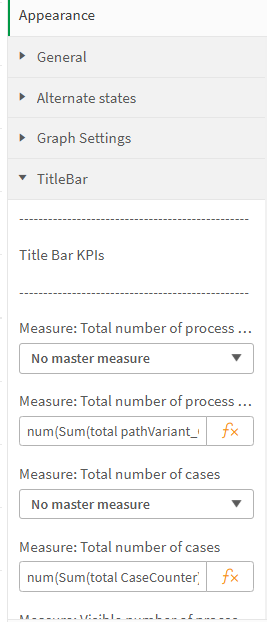
Titlebar
- Title Bar KPIs: The 4 key figures that are used in the display for the current selection (Showing ... process variants and ... number of cases). Can be adjusted, for example, if the field names change
Properties
The QID of the ProcessAnalyzer can be copied to the clipboard. This is required for setting up the ProcessModeler, because it refers to the associated ProcessAnalyzer, so its QID must be saved in the settings.

Context Menu
The sheets for the jump buttons can be stored in the context menu.
Context Menu: Nodes
- Select first sheet for navigation: Navigates to the stored sheet without selection.
- Select second sheet for navigation: Executes the selection for this node.
Context Menu: Edges
- Select first sheet for navigation: Navigates to the stored sheet without selection.
- Select second sheet for navigation: Executes the selection for this edge.
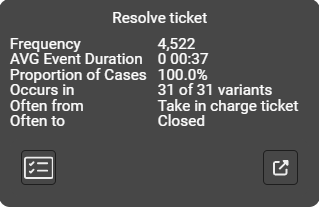
Info Dialog
Version & License Information
Version and license information of your mpmX ProcessAnalyzer can be found in the Info dialog.
Version
- Information on Version & License of used ProcessAnalyzer

License-Key
- Information on License Key of used ProcessAnalyzer
License-Expires
- Information on license expire date of used ProcessAnalyzer

License-Domains
- Information on licensed qlik domains of used ProcessAnalyzer