The Process Analyzer Overview
The Process Analyzer, the visualization extension, uses data from the process model and displays all occurring process variants including metrics like for example frequencies and lead times.
To use the Process Analyzer in a sheet, perform the following steps:
-
Click Edit Sheet and navigate to "Custom Objects" on the right.
-
In the section "mpmX Process Mining" drag and drop the Process Analyzer to the sheet. The Process Analyzer then will automatically display the process data if the data model is built correctly.
If the Process Analyzer shows the loading sign but does not show the process (that is correctly created in the data model) then switch the sheet, filter the data, or select the most common process and the visualization will work as expected.
The Process Analyzer is shown in the visualization below. The explanation of how to interpret the Process Analyzer visualization is explained in the Business User section.
How to configure the ProcessAnalyzer, e.g. it's process performance indicators (PPIs), to custom needs is explained in detail in the following pages.
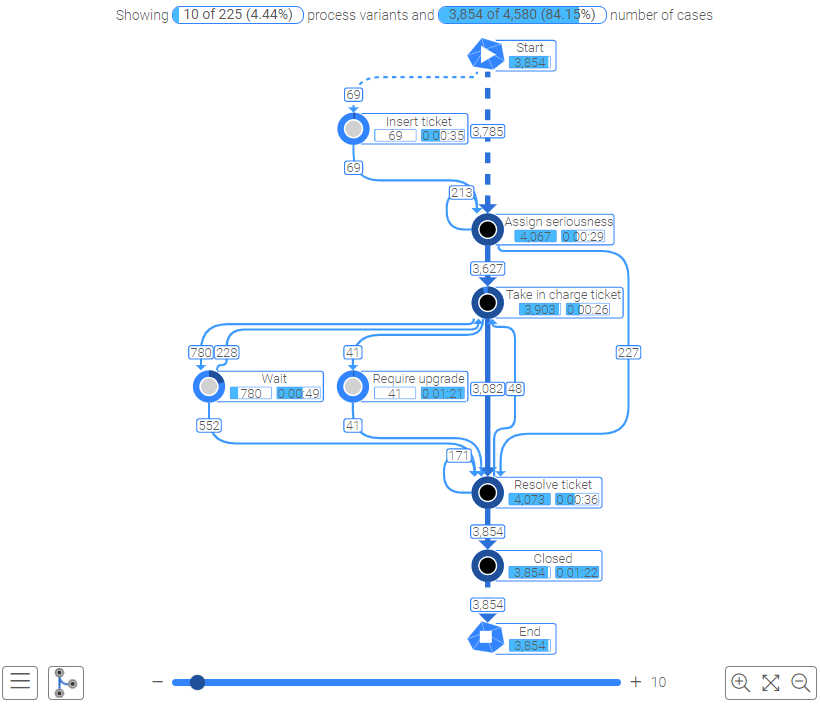
The visualization in the upper figure shows how many process variants are currently displayed compared to all possible process variants of the selection and how many cases they contain.
- The separation of the display from the selection enables greater flexibility in the analysis and a better overview of the process variants, since, for example, the top 10 process variants that occur can always be displayed.
Only process variants that are in the current selection can be displayed.
Learn more about configuring and using the process analyzer in the other pages in this section.