FAQs
Errors
All the fields in the EventLog and CaseInformation table are unique. Why do I get the error "Field names must be unique within table"?
Problem:
The following error occurred:
Field names must be unique within table.
The error occurred here:
pathMarker:
    NoConcatenate
    LOAD ProcessPathUniqueNo,
        ProcessVariant AS ProcessPath,
        firstRealActivityID AS ProcessStartsWithActivityTypeID,
        applyMap('MAP_ActivityTypes', firstRealActivityID) AS ProcessStartsWithActivityType,
        if (moreThanOneActivity = 1, lastRealActivityID) AS ProcessEndsWithActivityTypeID,
        if (moreThanOneActivity = 1, applyMap('MAP_ActivityTypes', lastRealActivityID) ) AS ProcessEndsWithActivityType,
        if (index(ProcessVariant, '-101-') > 0, 1, 0) AS [YourActivityName],
        .
        .
        .
        1 AS pathVariant_Counter
Data has not been loaded. Please correct the error and try loading again.
Solution:
This error occurs because you're trying to use the same ActivityTypeID for multiple different activities. Analyze the ActivityTypeIDs to detect duplicates.
The ProcessAnalyzer is not showing the process but an error.
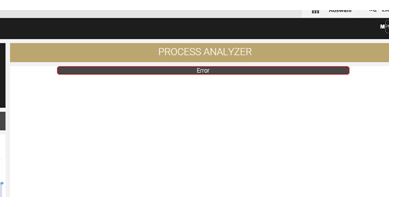
The license is not given to the domain by which you are connecting to the QlikSense server or the license has expired. Please contact your system administrator or MEHRWERK Support.
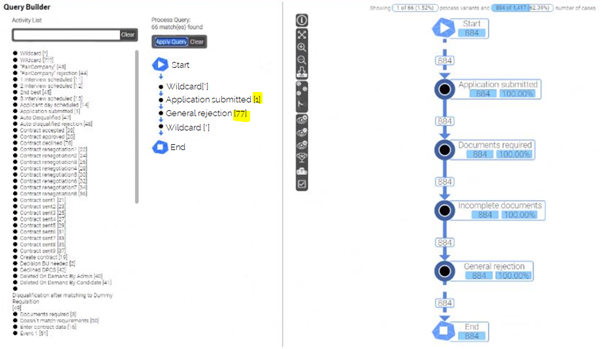
The query created in the QueryBuilder is not showing correct paths in the ProcessAnalyzer.
Problem:
ActivityTypeIDs have different lengths, as in the following example:
Solution:
Check the lengths of your Activities. All ActivityTypeIDs should have the same length. For example 3 digits, 4 digits or 5 digits. If the length is different than 3, additionally one property in the QueryBuilder needs to be changed by doing the following:
- Go to Process Pattern Analysis Sheet.
- Go to Edit mode.
- Click the QueryBuilder to see the properties.
- Go to Settings and change the field #digits of ID (Reload required) to the number of digits of your activities.
- Refresh the browser.
When dragging the ProcessAnalyzer to a sheet, it shows only the loading sign but not the process, even though, the data model is built correctly.
Switch the sheet, select the most common process or filter some values, the Process Analyzer will then stop showing the loading sign.
When I use the MPM BPMN Import Connector, I get the following error:
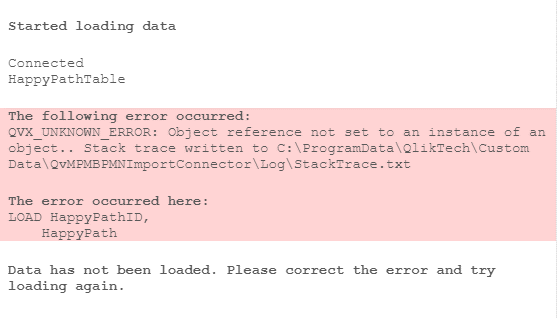
Two different problems are possible.
-
Problem:
The path has not the properly format or the file doesn't exist.
Solution:
Make sure your path contains the correct file name including the format at the end, as the following:
C:\Users\..\Documents\bpmn-import\bpmn-examples\PurchaseProcess.bpmn
-
Problem:
Your BPMN file does not meet the requirements.
Solution:
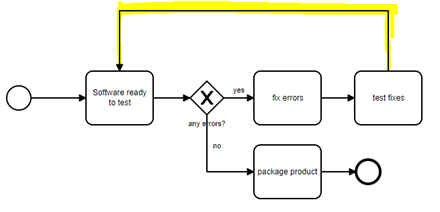
Make sure your BPMN does not have loops that start and end in the same place.
Example to avoid:
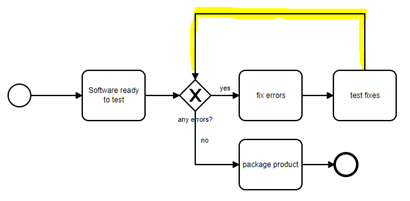
mpmX BPMN Import Connector error example to avoid From the example you can see that after the test fixes the software, it's ready to test again. Therefore, try to change your BPMN to the following:
mpmX BPMN Import Connector error solution 1 Or
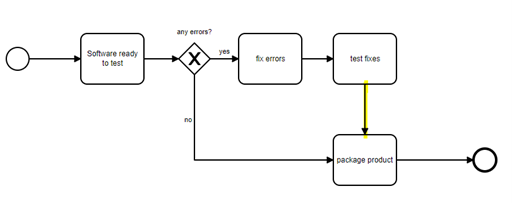
mpmX BPMN Import Connector error solution 2
Why does the following error occur? call MW_logError('do not use QlikView table names with blanks or brackets as part of the name. Change table name: MasterCalendar_Your Process')
Problem:
Value stored in mvProcessDescription has a blank draw.
Solution:
- Go to Data Load Script.
- Go to Simple_Data Load.
- In line 40, change the value stored in mvProcessDescription to a value without blank draws.
Example:
Let mvProcessDescription = ‘My Process‘ ❌ wrong
Let mvProcessDescription = ’My_Process’ ✔️ correct
Let mvProcessDescription = ’MyProcess’  ✔️ correct
Why does the following error occur? Unexpected token: 'Process', expected one of: 'Where', 'While', 'Group', 'Order'
Problem:
Value stored in mvProcessDescription has a blank draw.
Solution:
- Go to Data Load Script
- Go to Simple_Data Load
- In line 40, change the value stored in mvProcessDescription to a value without blank draws.
Example:
Let mvProcessDescription = ‘My Process‘ ❌ wrong
Let mvProcessDescription = ’My_Process’ ✔️ correct
Let mvProcessDescription = ’MyProcess’  ✔️ correct
General questions about the mpmX Template App
How can I translate the Template App?
If you want to translate the current app, perform the following steps:
- Add a new column in the Translations.csv file with the desired translations. Name the column as the language abbreviation, i.e. Spanish: ES, English: EN, Russian: RU, etc.
- Go to “6. Language & Master Items” script tab and add the new column field in the table InputTranslations.
If you want to add new elements as sheets, KPIs and diagrams and translate them, see chapter Translate the Template App to a Custom Language.
If you want to have information about the tables in the mpmX data model, see chapter Understand the mpmX Master Item and Language Tables.
I want to use a sorting criteria for activites that have the same timestamp, how do I do that?
The mpmX ProcessMining Algorithms sort activities first by timestamp, second by a sorting criteria and third by the activity type ID. The sorting criteria can be set here Reuse the Event Log Template to Define Your Event Log.
KPI creation
I want to count all the activities that start with the word "Change". How can I do that?
You can use the wildcard character (*) within a set expression to search a specific string. (For more information please see Qlik's help.)
Example:
count({<ActivityType={"Change*"}>}distinct ActivityType)
I want to count all the activites stored in a variable. How can I do that?
You can create a variable in the variable panel and in the definition you can write the activity list as a string. Then in a KPI object, you can use this variable in a set expression to count the activities.
Example:
Variable name:
vRework_Activities
Variable definition:
'Require upgrade', 'Resolve SW anomaly', 'Schedule intervention'
Formula KPI:
count({<ActivityType={$(vRework_Activities)}>}distinct ActivityType)
I want to count the number of cases that contain a specific sequence of activities (i.e. 'EventA' to any activities to 'EventB'). How can I do that?
Suppose that EventA has ActivityTypeID 101 and EventB 108.
The question is, you want processes EventA-ANY-EventB? Meaning that they start with EventA and end up with EventB (0-EventA-ANY-EventB-99999999), then the formula is:
count({<ProcessPath={"0-101-*108-99999999"}>} distinct CaseID)
Or you want to look up for processes that have any activities and within their sequence is one like EventA-ANY-EventB (i.e. 0-EventX-EventY-EventA-ANY-EventB-EventW-EventZ-99999999)? If it's like this, then your formula is:
count({<ProcessPath={"0-*101-*108-*99999999"}>} distinct CaseID)
Take into consideration that all ProcessPath's start with 0 and end up with 99999999.
I want to count the number of cases that contain an 'EventA' directly followed by 'EventB'. How can I do that?
Considering the previous explanation, the formula for EventA directly followed by EventB (i.e. 0-EventX-EventY-EventA-EventB-EventW-EventZ-99999999) is either:
count({<ProcessPath={"0-*101-108-*99999999"}>} distinct CaseID)
or:
count({$<CaseID = P({1<EdgeID={'101-108'}>} CaseID)>} distinct CaseID)
I want to count the number of cases whose EventA is never followed by EventB. How can I do that?
The EventA never followed by EventB is the same as that the EventA-EventB sequence does not exists within a case, therefore the formula is either:
count({<ProcessPath=-{"0-*101-108-*99999999"}>} distinct CaseID)
or:
count({$<CaseID = E({1<EdgeID={'101-108'}>} CaseID)>} distinct CaseID)
Questions about the mpmX extensions
How can I limit the data shown in the ProcessAnalyzer with a set expression?
Let's say you create a flag in the script:
if( Rand1 > 5 and Rand2 < 30, 1, 0) as Flag
Then in the front end you could use the flag as set expression to limit the data:
{<Flag={'1'}>}
For more information about Set expression, please see Qlik's help.
The fields to change in the ProcessAnalyzer are:
- Data
- Nodes
- Measure 1
- Measure 2
- Measure 3
- Edges
- Measure 1
- Measure 2
- Measure 3
- Process Paths
- Measure for process path
- Group Nodes
- Measure 1
- Measure 2
- Measure 3
- Nodes
- Appearance
- InfoBox & TitleBar
-
Scroll down until these options:
Title Bar KPIs
-
- InfoBox & TitleBar
To apply your set expression, you need to replace the current set expression:
{<ProcessPathUniqueNo={$(mw_selectedProcessPaths)}>}
always with:
{<ProcessPathUniqueNo={$(mw_selectedProcessPaths)}, Flag = {'1'}>}
Just in the case of Data -> Process Paths -> Measure for process path and Appearance -> Total number of process paths and Appearance -> total number of cases, you need to apply:
{<Flag = {'1'}>}
How can I use a new ProcessModeler and a new ProcessAnalyzer together in a new sheet?
- Drag a new ProcessAnalyzer and ProcessModeler to the desire sheet.
- With the new ProcessAnalyzer: Go to Edit mode.
- Click on the ProcessAnalyzer and then onProperties at the right side bar.
- Click Copy qID.
- With the new ProcessModeler: Go to Editmode.
- Clik on the ProcessModeler and then onSettings at the right side bar.
- Paste the copied qID in target qID.
What is the difference between a continuous line and a dashed one in the ProcessAnalyzer?
A dashed line is a fictitious line created in the algorithms to connect the fictitious nodes Start and End with the activities in your data. All other continuous lines connect the real activities from the event log.
Miscellaneous
What are QVD, QVS and QVF files?
- QVD files: A QVD (QlikView Data) file is a file (native Qlik format) containing a table of data exported from Qlik Sense optimized for speed. Please see Qlik's help for more information.
- QVS files: A QVS (QlikView Script) file is a text file containing Qlik script. It is used to centralize reusable script functions. The Qlik included functions can be used to include a script file inside a script (in a Qlik app).
- QVF files: A QVF is a file containing all the information from an app. This includes the script, data and visualizations.
How do I configure a link to SAP GUI (desktop) from my MPM Dashboard?
There are two possibilities when configuring a link to SAP from the mpmX Dashboard. The link will work for single document numbers only, therefore, you configure a table with the document number as one dimension and with the link as second dimension. If the Qlik and the SAP user are equal go for option two. If they are not, use the logic from option 1.
-
The Qlik User is not a SAP User. In this case, a mapping table is configured in the data editor which assigns a SAP user to the Qlik user. Then, the following syntax must be used (the example is referring to the "Transaction Show Purchase Orders" / ME21).
='https://tools.mehrwerk.net/sap/sap_link.html?'
& 'System_Name=S/4 HANA' //Has to be equal to SAP System Configuration
& '&System_Description=S/4 HANA' //Has to be equal to SAP System Configuration
& '&System_Client=100' //Can also be dynamically
& '&User_Name=' & aggr(only({<OS_User = {'$(=right(OSUSER(), len(OSUSER()) – Index(OSUSER(),'UserId=')-6))'}>}SAP_User),SAP_User)
& '&User_Language=EN' //Can also be dynamically
& '&Function_Title=Show POs’ //Function Title
& '&Function_Command=FB03 RF05L-BELNR=' & PO_Order //Multiple Fields can be added with “;”. Example: & '&Function_Command=FB03 RF05L-BELNR=' & [FI Document Number] &';RF05L-BUKRS=' & [Company Code] & ';RF05L-GJAHR=' & [Fiscal Year] -
The Qlik user corresponds to the SAP user. In this case, use the following code shown in the "Show Documents" / FB03 example.
='https://sap.mehrwerk.net/sap_link.html?'
& 'System_Name=S/4 HANA System 1' //Has to be equal to SAP System Configuration
& '&System_Description=S/4 HANA System 1' //Has to be equal to SAP System Configuration
& '&System_Client=' & Client //Can also be dynamically
& '&User_Name=' & right(OSUSER(), len(OSUSER()) – Index(OSUSER(),'UserId=')-6)
& '&User_Language=EN'
& '&Function_Title=Document List' //Function Title
& '&Function_Command=FB03 RF05L-BELNR=' & [FI Document Number] & ';RF05L-BUKRS=' & [Company Code] & ';RF05L-GJAHR=' & [Fiscal Year]
The expression must be pasted in the data section of the editing tool in the app. Configure it as a link.

When closing the edit mode you will see a link for every SAP document called "SAP GUI".