Define a Hover menu
-
Select a visualisation for which you want to define the Hover menu in edit mode.
-
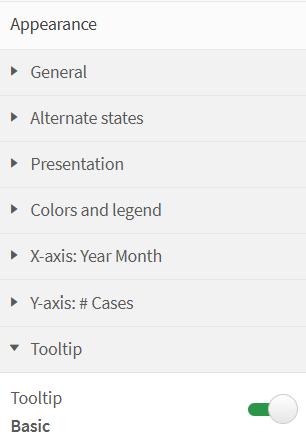
In the configuration view, unfold the "Appearance" tab and then expand "Tooltip".
-
Move the "Basic" slider to "Custom".
-
Configuration Possibilities:
Hover- Display Quickinfo 1 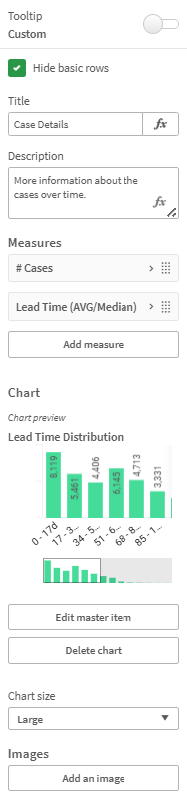
Hover - Display Quickinfo 2 -
Title: Give the Tooltip, the hover menu a descriptive name
-
Description: Provide a description of how the user can interpret the additional information provided
-
Measures: Define additional key measures to be displayed in the chart. Take into account that the measure is automatically filtered based on the displayed dimension. (Dimension in basic visualisation (the visualisation in which the key figure should also be displayed): Supplier -> The measure # Cases is then automatically calculated for the supplier that the end user is currently hovering over)
-
Chart: A maximum of 1 chart can be stored, which is also filtered like the key measures based on the dimensions in the basic visualisation.
Important!If you want to store your own visualisation, you must first store it as a master visualisation and then select it from the list.
- Images: Insert a link to an image or select an image from the library
-