Advanced Funtionalities (optional) tab
The Advanced Functionalities tab itself has several subtabs.
The first tab, Advanced Customizations, must be completed to create an app.
All the other tabs are optional and offer additional configurations that may be useful in your analysis.
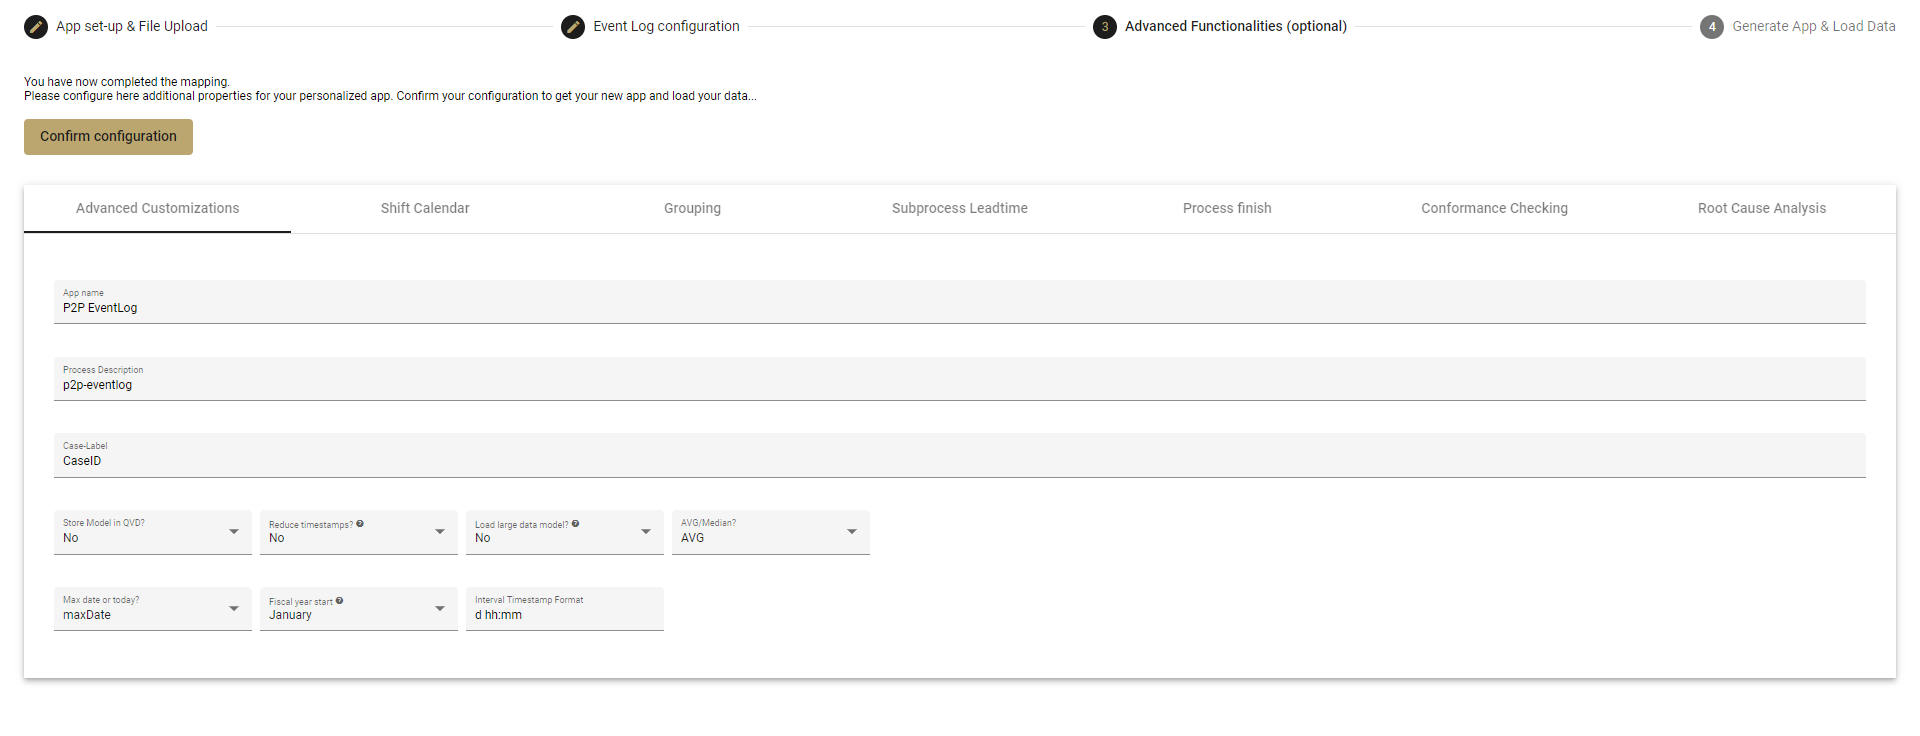
Advanced Customizations
The first option you have is to adjust some general measures. Use the Advanced Customization tab to set the process description, case name, and customize the timestamp format, among other things.
-
App name:
- Here you could edit the app's name.
-
Process description:
- Here you can edit the description to make the app fit better to the process.
-
Case-Label:
- Adjust the case label to make your data easier to read when working in the app. So, instead of CaseID, change it to Purchase Order or whatever the cases actually are.
-
Store Model in QVD:
- No = the data model will be stored in RAM. This is recommended for most users, but is not suitable for large data sets.
- Yes = the data model will be saved in the data connection you specified in the App Set-up & File Upload tab at the beginning.
-
Reduce Timestamps to Minutes
- Yes: The lead and process times will not be affected, only how they are displayed will be in rounded up or down to minutes (vs seconds or milliseconds)
- The benefit of rounding up to the minute is that there would be fewer unique field values in the data model which would make it, from a technical perspective, easier to load, to cache, and to work with.
- This is recommended in cases where you don’t need to be so precise.
-
Load Large Data Model
- No = several fields, not often used, will not be loaded into the data model
- Fields ProcessPathWithLoops
- nextActivityType
- nextActivityID
- nextActivityTimestamp
- previousActivityType
- previousActivityTypeID
- previousActivityTimestamp
- This will improve performance without sacrificing any features
- Yes = the extra fields will also be included
- No = several fields, not often used, will not be loaded into the data model
-
AVG/Median
- Determines whether time-related PPIs, such as lead time, should be displayed as average or median by default.
- Regardless of what is chosen here, users still have the ability to switch between these two options when working in the app.
- If you are working with a multilanguage template app, there will be a placed here to set the preferred language.
-
Max date or today?
-
Lets you set the reference data to either the maximum date in your event log or to today for timespans in the app, such as year-to-date or month-to-date analysis.
-
If set to "today" the app will use the date from the last time you reloaded data into the app.
-
If set to "max date" the time comparison will use the maximum date in the data.
-
So, for example, if you wanted a year-to-date analysis of the average lead time you could decide if your timespan stopped at the last date in your event log (max date) or stopped at the date when you loaded the data into the app (today).
-
Fiscal Year Start
- Choose the month when your fiscal year starts, e.g. January or April.
- This is used as the starting month for all time comparisons in the app.
-
Interval Timestamp Format
- Specify which timestamp format you want in your app.
- There are many options but what you choose has to be in a specific format.
- For more information, check out Qlik Help's timestamp format.
-
-
Real User Wildmatch
- RealUser is a field in the data model that shows if the user for each activity is a human or not.
- This field is used to calculate automation rates.
- This field holds a flag
- 1 = the activity was completed by a human
- 0 = the activity was automated by a machine or batch user
- In the app, each user is determined to be a real user or a machine by comparing the user's name to the parameters which are specified here in this field.
- Enter in this field any words that will be included in names for non-human users, e.g. 'batch'. Any user whose name contains the word batch will be assigned a 0, indicating that this user in not a human.
- You can use the wildcards * or ? in your parameters.
- Put each parameter in 'single quotes' and separate them with commas, e.g. 'batch*', 'machine*'.
-
Rework Event wildmatch
- A rework event is any activity that indicates an unexpected change, such as a Purchase Order being adjusted or deleted.
- Similar to Real User, each activity will be compared to keywords that are entered here, which will indicate rework, e.g. 'Delete', 'Change', 'Cancel'.
Shift Calendar
A shift calendar helps you identify the hours when work is actually done to refine your case times and lead times. It is used to calculate net process time.
- Turning this feature on will calculate only actual working time.
- NetProcessTime is the total time spent on a process without breaks, time off, holidays, and weekends.
- For instance, if a task is started on Friday morning and is completed on Monday end of day, then it took two whole working days to complete, but four calendar days.
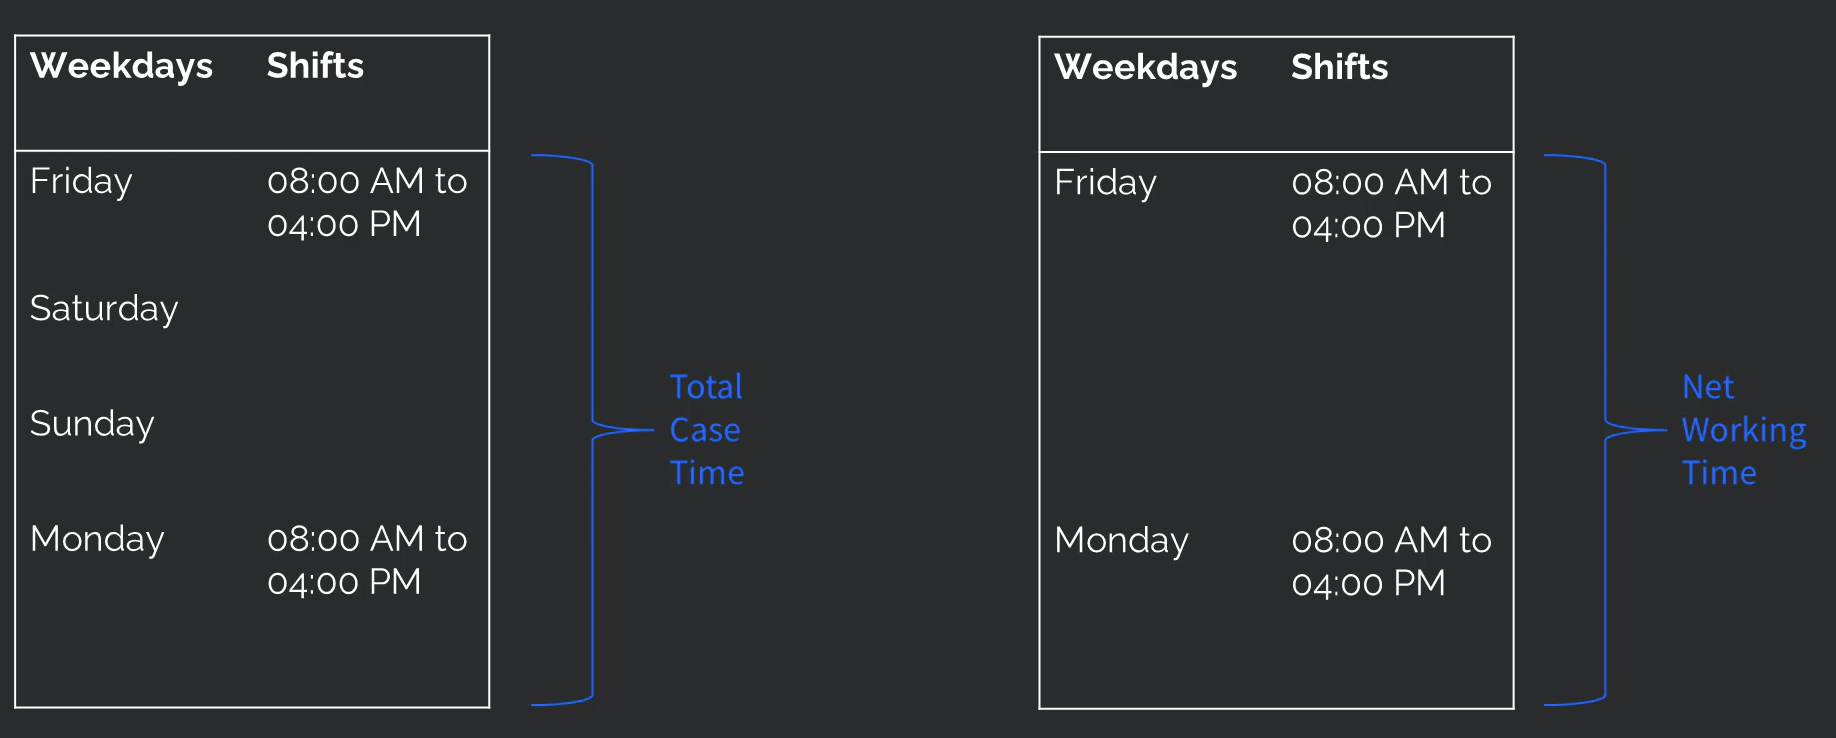
Total Case Time vs Net Time Example
Here is how to create a shift calendar.
- Click on the Add Shift button
- Select a weekday
- Add the start time and end time for the shift.
- You can create multiple shifts in a day, either to create an early shift and a late shift, or to remove the lunch break from the working time as seen here:
- Mon: 08:30-13:30
- Mon: 14:30-18:30
- If your late night shift goes past midnight, then it must be broken into two parts - from the start of the shift until midnight, and from midnight to the end of the shift:
- Tue: 21:00-24:00
- Wed: 24:00-05:00
- You can delete the shift by clicking on the x symbol on the left side.
- Delete all shift calendar contents by clicking on the Reset all button.
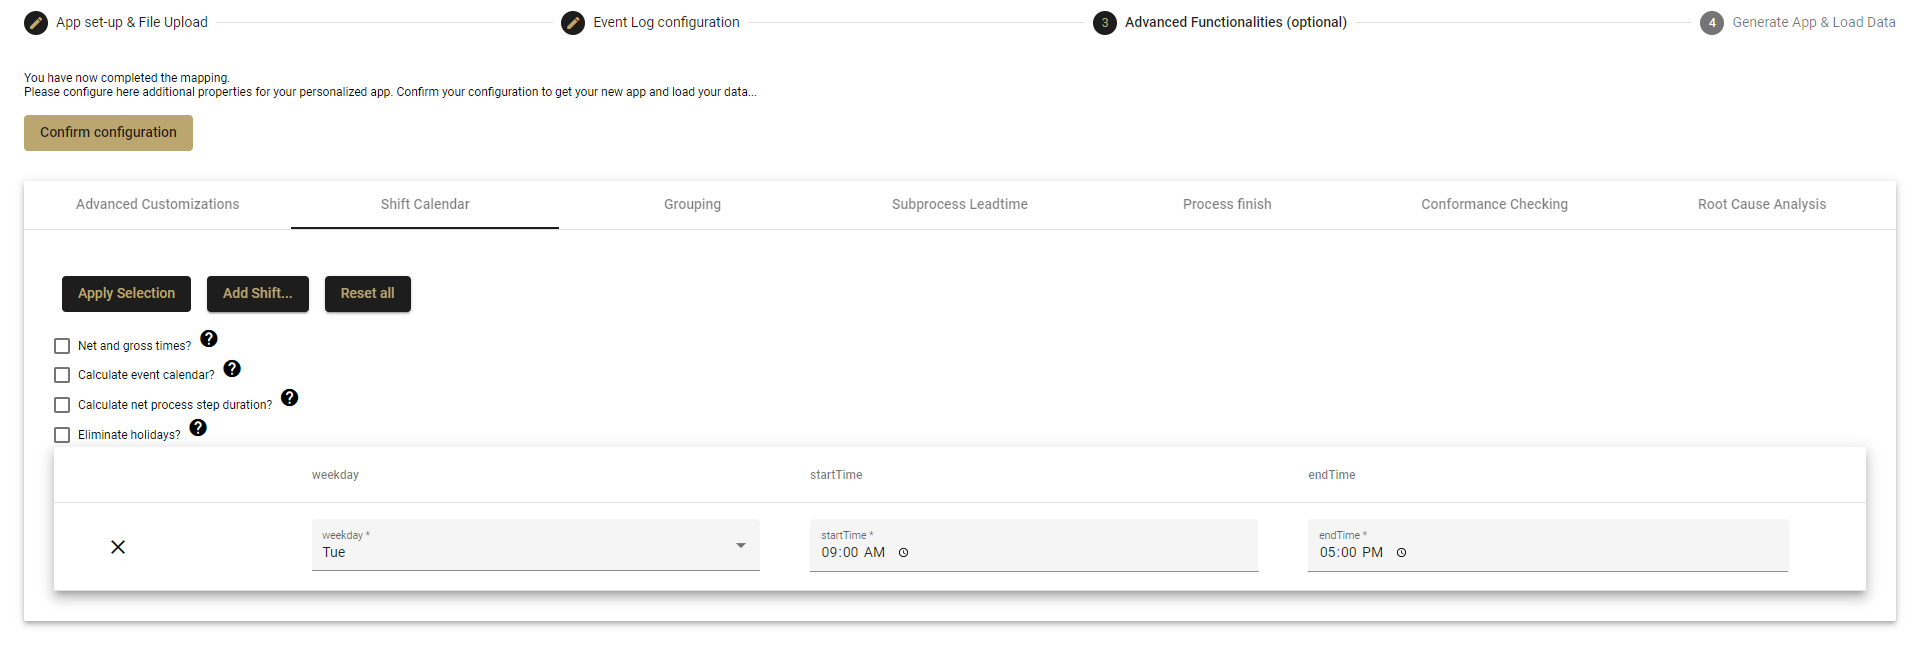
For further configuration of the Shift Calender there are four options:
-
Calculate net and gross time:
- This variable is only relevant if you have created a Shift Calendar. If you have no Shift Calendar, then all times are shown as gross time.
- Choose if all time-related values will be expressed as both net and gross times.
- If the variable is active and the shift calendar is set, then two columns for each time-related field will be created (e.g. CaseLeadTime and NetCaseLeadTime).
-
Calculate event calendar:
- Choose if you want to use the event calender or not.
- The event Calendar is needed for displaying the shift in which an event took place.
⚠️ Warning: If the calender is calculated, the script performance will slow down.
- Calculate net process step duration:
- Choose if you would like to calculate the net process step duration or not.
- When left unchecked (the default) if you have shifts but complete work outside of the shifts (during a weekend or holiday or after the shift ended), then that work time will still be counted but an overtime flag will be set.
- Check this option if you do not want to count the extra work that may be done outside of the shifts.
💡 Note: The result is that the process step duration is reduced, although work was done.
- Eliminate holidays:
- Choose if you like to eliminate holidays by activating this option.
- Deactivate if you would NOT like to eliminate holidays from your working time.
- When activated, holidays will be counted as workdays. This is useful in jobs where it is required to work every day, such as in hospitals, the police, or factories that continually operate.
- If checked, you must select from the dropdown which calendar to use. The Data Engineer Guide discusses how to add different national/state calendar options or how to create a custom calendar in Use a Factory and Shift Calendar Template.
When the shifts are completely defined click on the Apply Selection button to confirm.
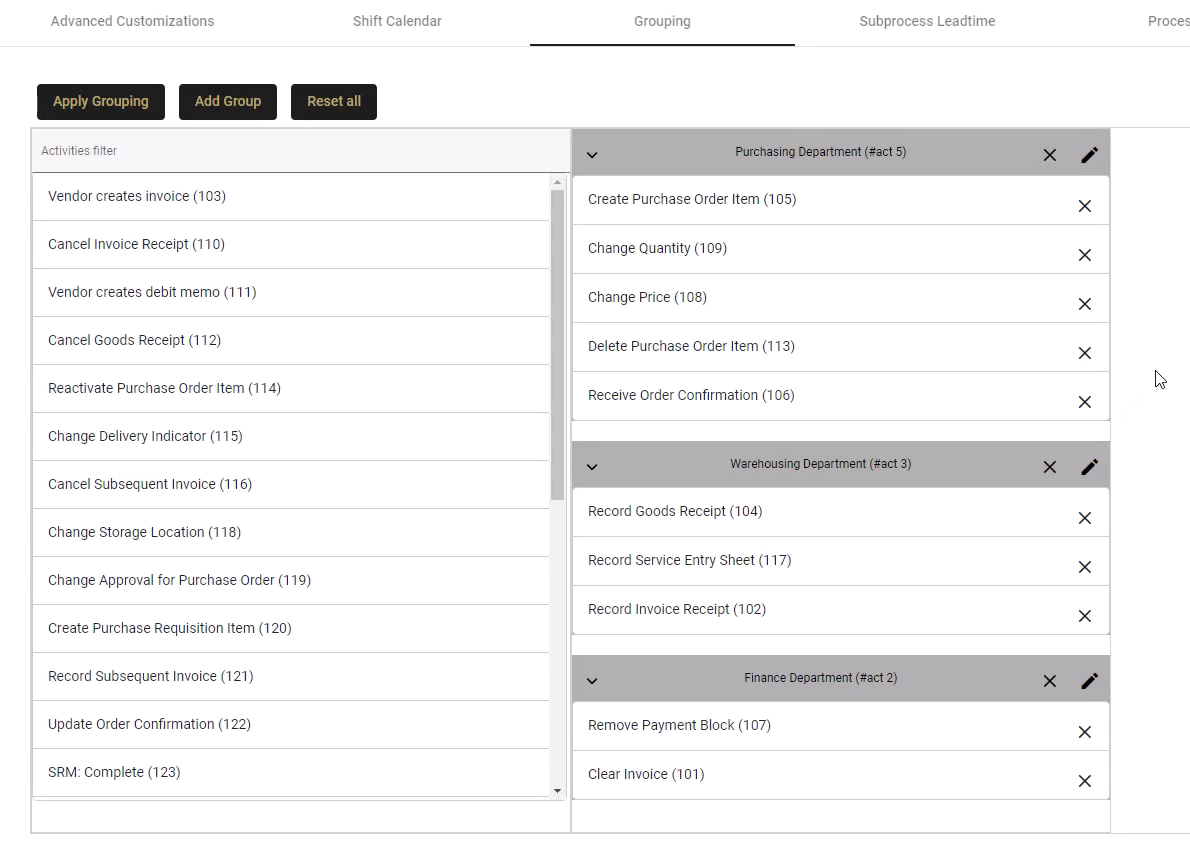
Grouping
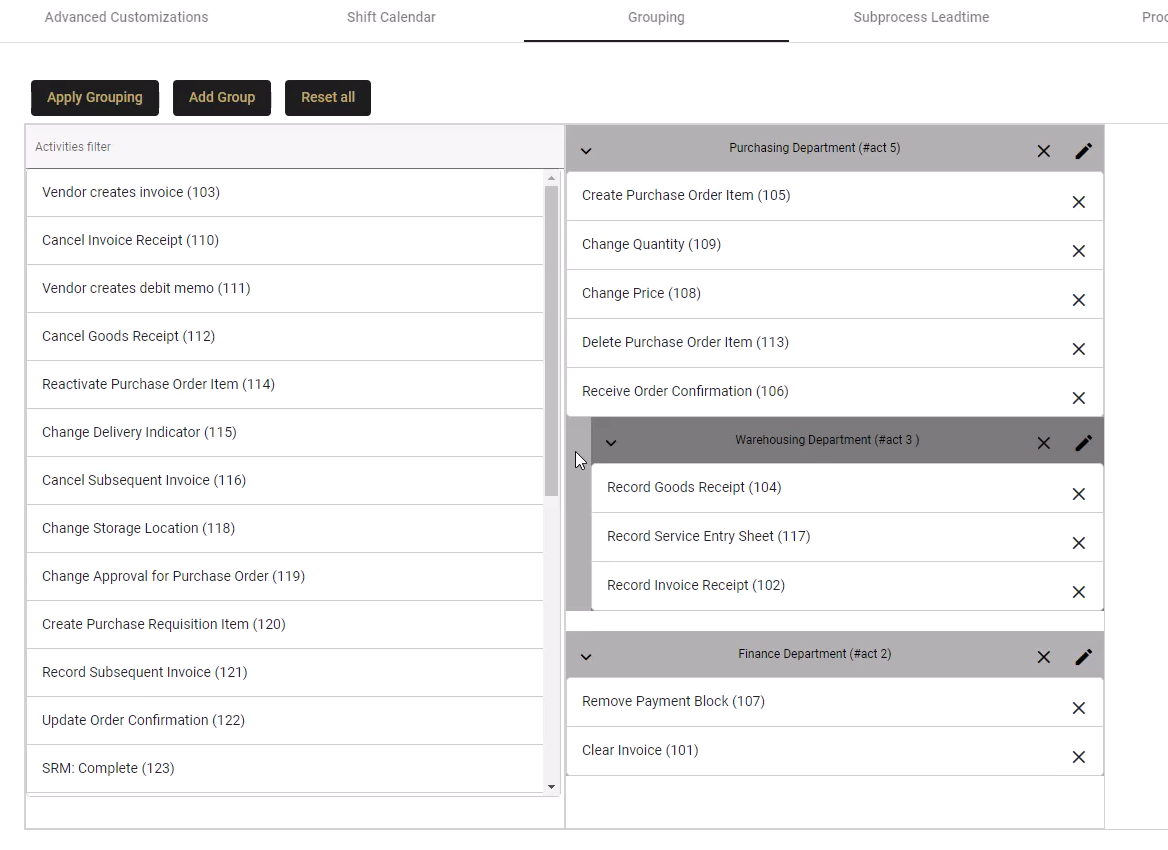
Grouping is a useful feature to combine activities more a more simple analysis. You may want to group process activities by Department, for example.
- Click Add Group and a new group appears in the empty space on the right of the activity list.
- Give your group a name by clicking on the pencil-symbol.
- Drag and drop the activities below the group name.
- You can create several groups, or switch activities from one group to another.
- Once your groups are defined click on Apply Grouping. You can also delete a group by clicking on the x icon on its right.
- Remove an activity from a group by clicking on the x next to the activity.
- Delete a group by clicking on the x next to the group name.
- When done, click Apply Grouping
Parent Groups
Creating parent groups is useful because it lets you switch from looking at a high-level analysis of your process and expanding the groups to look at a more detailed analysis in the process analyzer.
- Create nested groups, with a parent and child group, by dragging one group onto another.
- They are useful is using the same event log information but displaying only the relevant information to different stakeholders.
- Parent groups can be used to separate activities by department but it can also be used to divide between standard process steps and undesired process steps.
Parent Group
More information on enable Grouping is found in the Data Engineer Guide.
Subprocess Leadtime
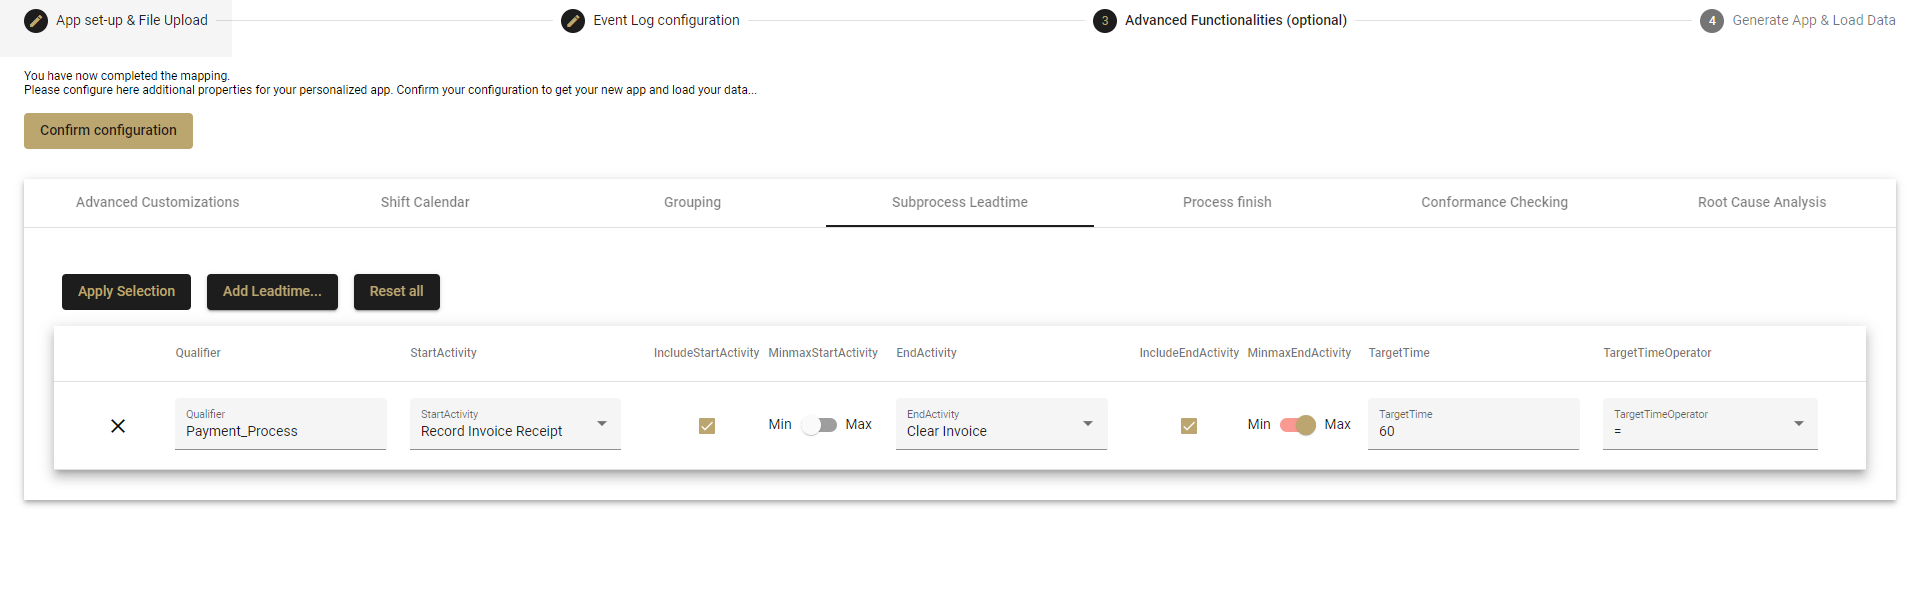
Here you have the opportunity to define a custom subprocess by choosing any start or end activity you want.
Use Cases
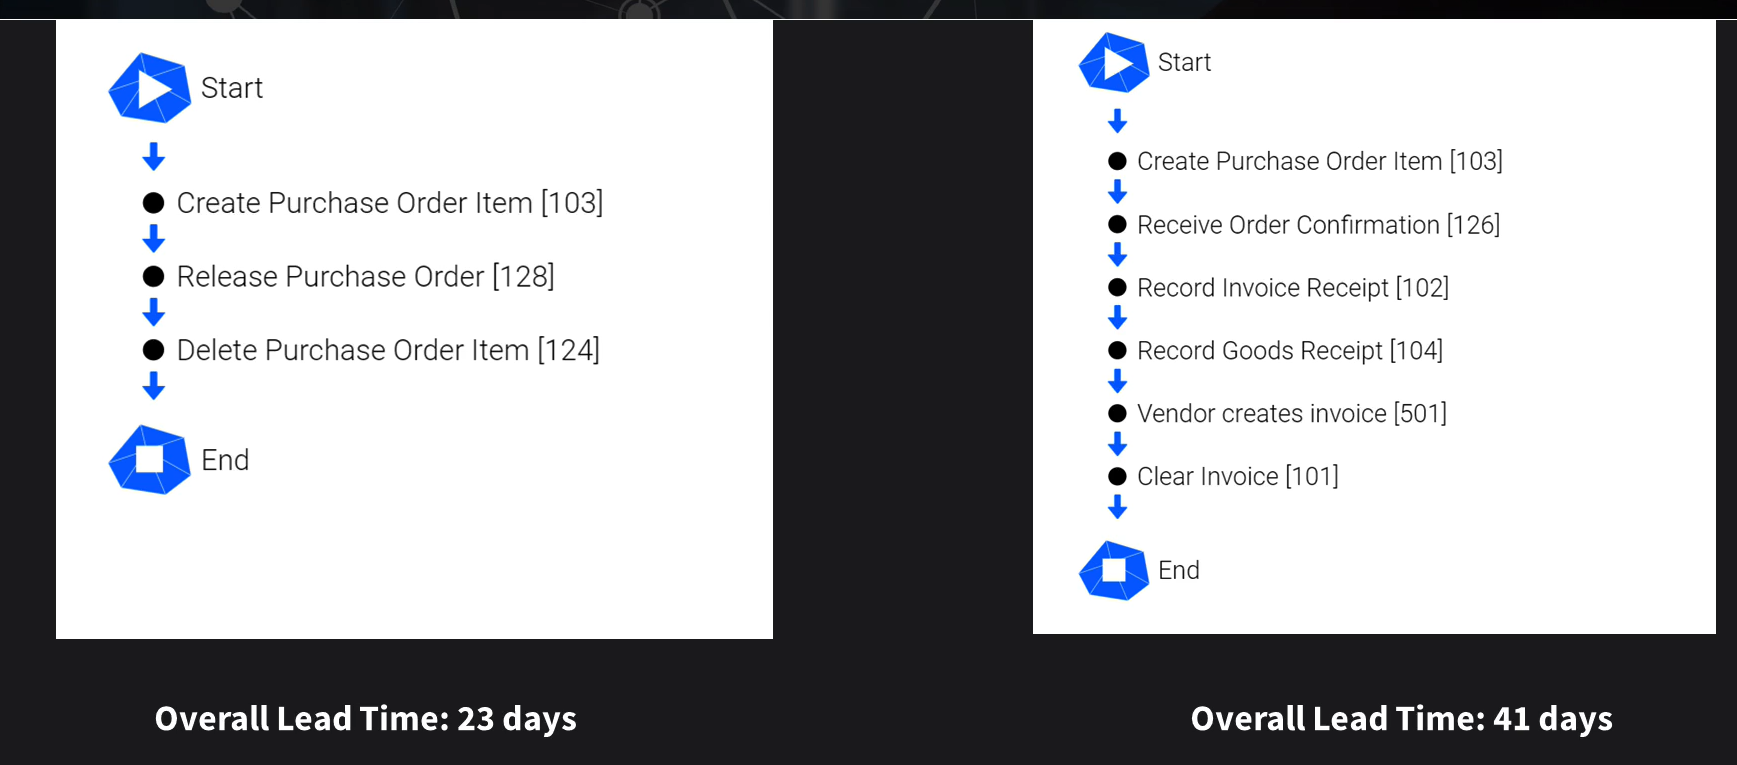
Sometimes, the regular leadtime calculated in a process from the start of a process to its end is not the most useful. Normally, every variation of all cases is included.
Use Case 1
Sometimes processes end before fully completing the ideal flow - like a order being cancelled instead of going on the delivery and payment. The leadtime might be shorter here, but it is not the ideal scenario, so we may not want to include that variation in a particular analysis. We want to shorten the optimal process that ends in payment.
Use Case 2
Another example is when two cases finish within the same time, but their leadtimes between individual steps are quite different. Here in the first example, the case needed 40 days between Cancel Goods Receipt and Record Invoice Receipt and another 20 days until Clear Invoice. In the second example the case needed only a 1 day to go from Cancel Goods Receipt to Record Invoice Receipt but a full 59 days until the Clear Invoice activity was completed.
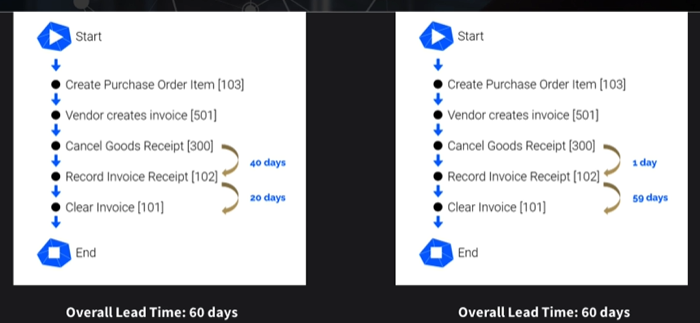
While the steps were the same each of these cases are very different and indicate a need for different optimizations. These differences also would not have been detected looking at the overall leadtime of 60 days.
To configure partial processes follow these steps:
-
Open the Subprocess tab.
-
Click on the Add Leadtime... button
-
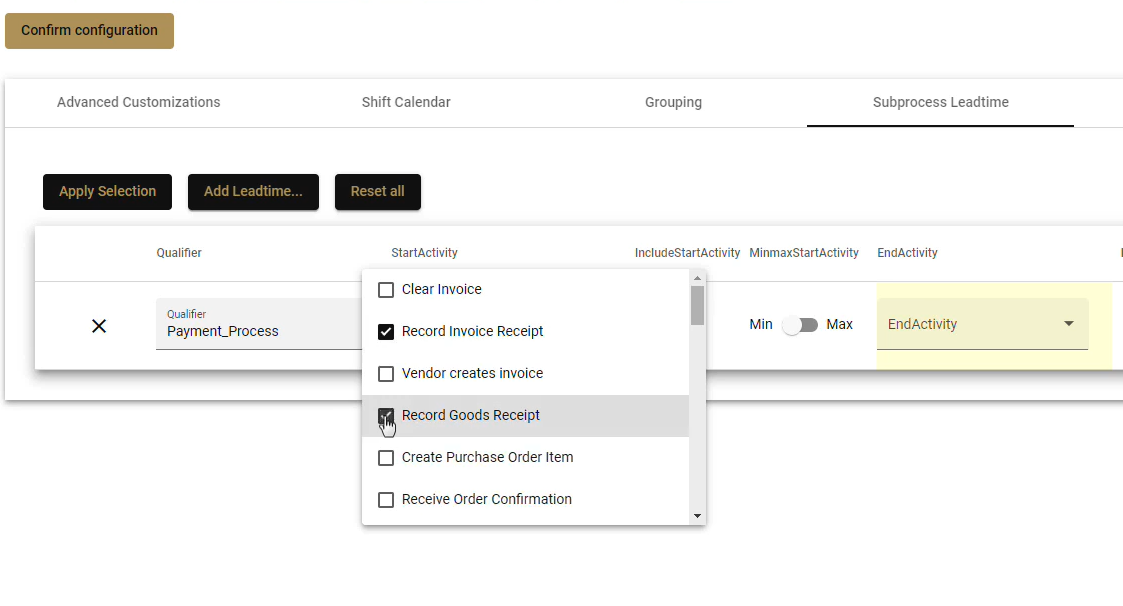
Give your subprocess a name in the Qualifier field.
-
Select a start and end activity in the dropdowns.
- You can also select multiple start or end activities if you want to have more variations included. Simply select multiple checkboxes in the dropdowns.
- When you havve multiple start or end activities any one of the start activities could trigger the start of your subprocess, or its end.
Subprocess Multiple Start Activities - Looking at Use Case 1 above, by selecting Clear Invoice as our end activity we will avoid including the undesirable short case variants where the process finished due to a cancellation.
-
The checkbox IncludeStartActivity allows you to specify if you want to include the duration of this activity in the subprocess leadtime calculation.
- Checking this box will use the activity's StartTimestamp will be used as starting point.
- If it is unchecked, and the activity is not included, then the activity's EndTimestamp will be the starting point for the subprocess.
- This is only relevant if your data includes the time duration for each activity. If you only use a single StartAndEndTimestamp, then this option does not matter.
-
The option MinmaxStartActivity is only relevant if the activity is repeated or if you select multiple start (or end) activities.
- Here we specify whether the first occurrence of the set of activities (min start activity) or the last occurrence (max start activity) will trigger the start of the leadtime.
- In the picture above, where we have multiple start activities, we have selected that either Record Invoice Receipt or Record Goods Receipt could start the process.
- For cases that had only one of these activities, regardless of which, then that activity would be the start of the timing of the subprocess.
- Our subprocess example above had both of these activities. Let's assume our case went from Record Goods Receipt to Record Invoice Receipt. With the option set to Min, then Record Goods Receipt would trigger the start of the leadtime since it was the first activity to occur. Had we selected Max, then the Record Invoice Receipt would have triggered the leadtime calculation, since it had occurred last.
-
TargetTime & TargetTimeOperator
- Set a goal that you want your subprocess time to reach.
- Example: You want the process to finish in under 30 days, then enter 30 in the Target Time and
<=as the Operator.
-
You can add multiple leadtime lines in this table to identify various subprocess examples.
-
You can delete subprocesses by clicking on the x symbol on the right side.
-
Click the Reset all button to erase everything and start over.
-
When the subprocesses are defined click on the Apply Selection button to confirm.
More information on how to Define Subprocesses can be found in the Data Engineer Guide.
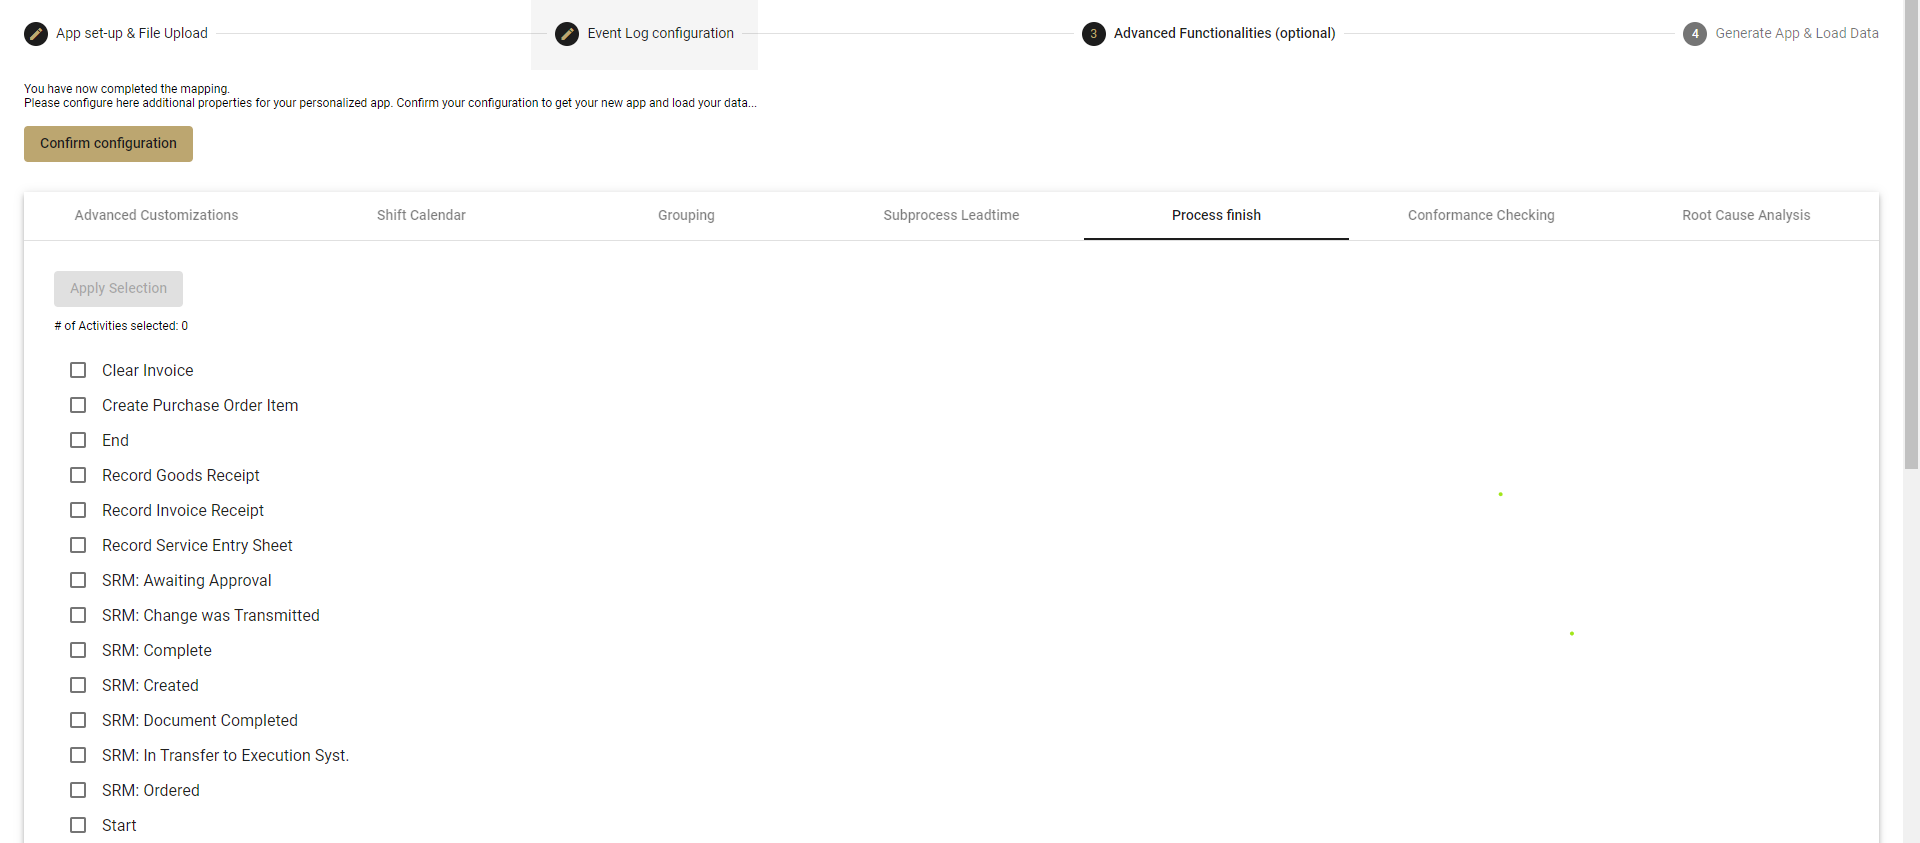
Process Finish
By default, mpmX app shows leadtimes and other information from an average of all cases, but this can sometimes be misleading.
- For example, cases that are not finished will have shorter leadtimes just because they have not reached the end.
- The number of process variants (specific path that each case takes) will be greater if you include both open and closed cases, than if you only counted closed cases.
There are many situations where it is beneficial to only analyse cases that are closed, or finished. To do this, we have to define when a case is considered as finished.
- Tick the activities which define a process end. Multiple activities can be selected.
- The list includes all activities in your event log.
- Click on Apply Selection to save your configuration.
More information on how to configure when the process is finished can be found in the Data Engineer Guide.
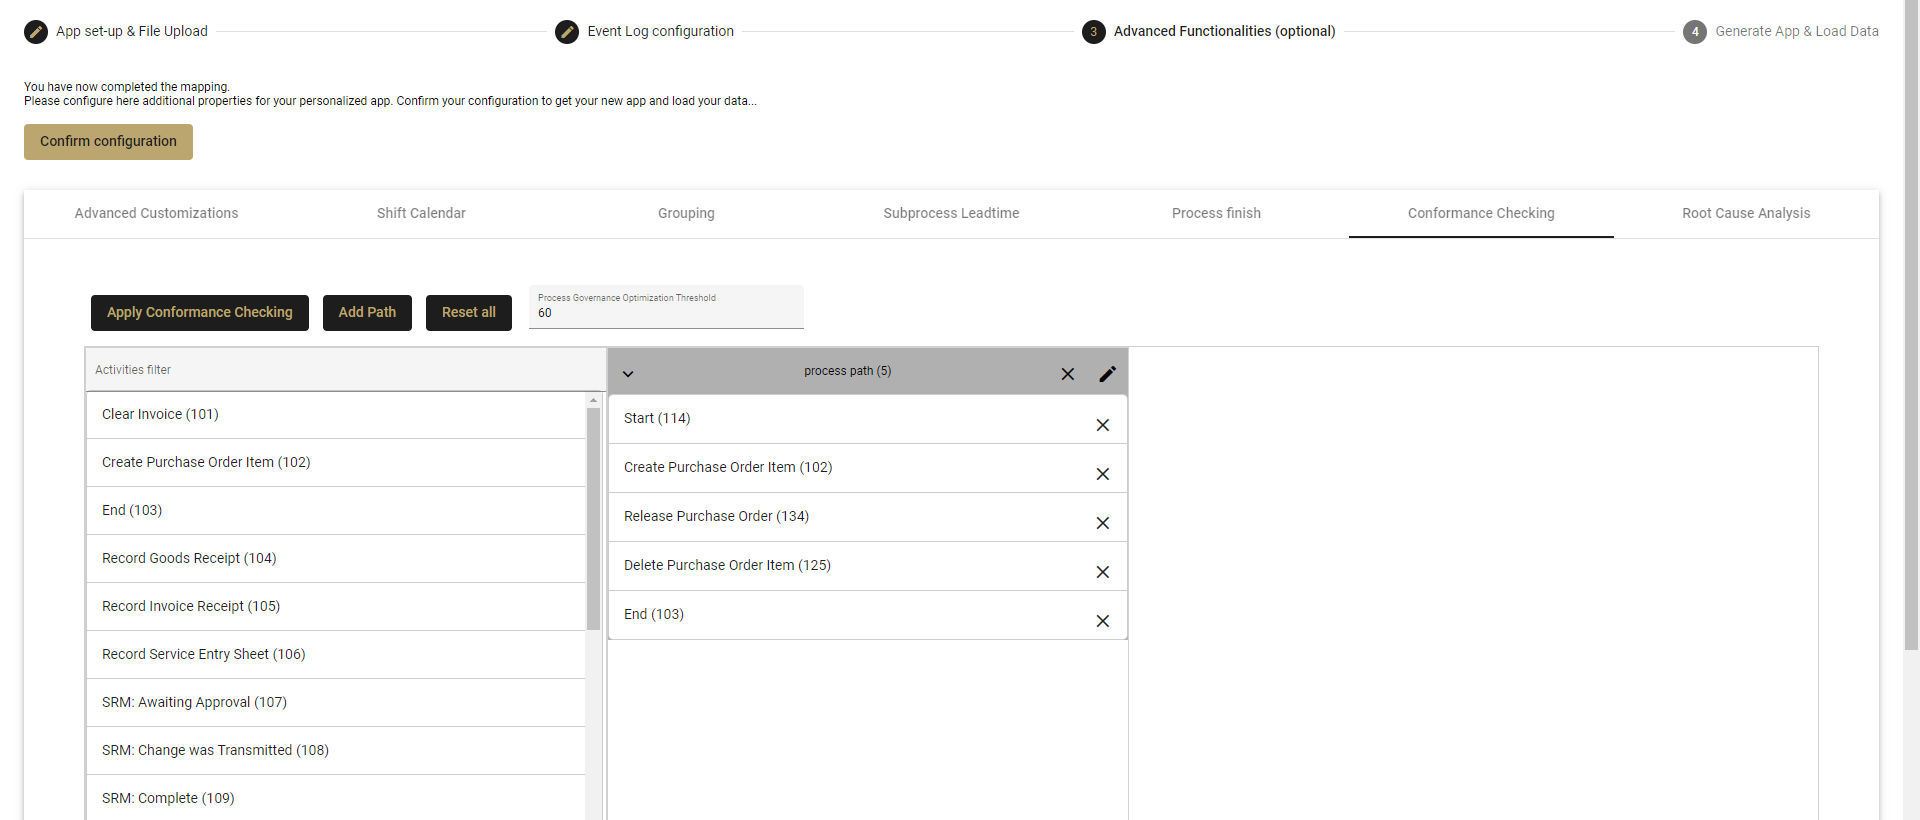
Conformance Checking
This is were you define your Happy Path, or ideal process path(s), as the model that other variants will be compared against. This is necessary for the mpmX process governance analysis to determine how conformant your current process is.
- Click on Add Path.
- Name your happy path by clicking on the pen symbol.
- Drag and drop the activities and place them in order to define your happy path.
- Several happy paths can be defined.
- To delete an activity from the Happy Path click the x next to the activity.
- Delete a happy path by clicking on the x next to the happy path's name.
- Process Governance Optimization Threshold
- This determines the point where a case is considered a success.
- An 80 here (default) means 80% conformance.
- Any case not achieving this level of conformance will be flagged for further analysis.
- Click on Apply Conformance Checking to save your configuration.
More information on Conformance Checking can be found in the Data Engineer Guide.
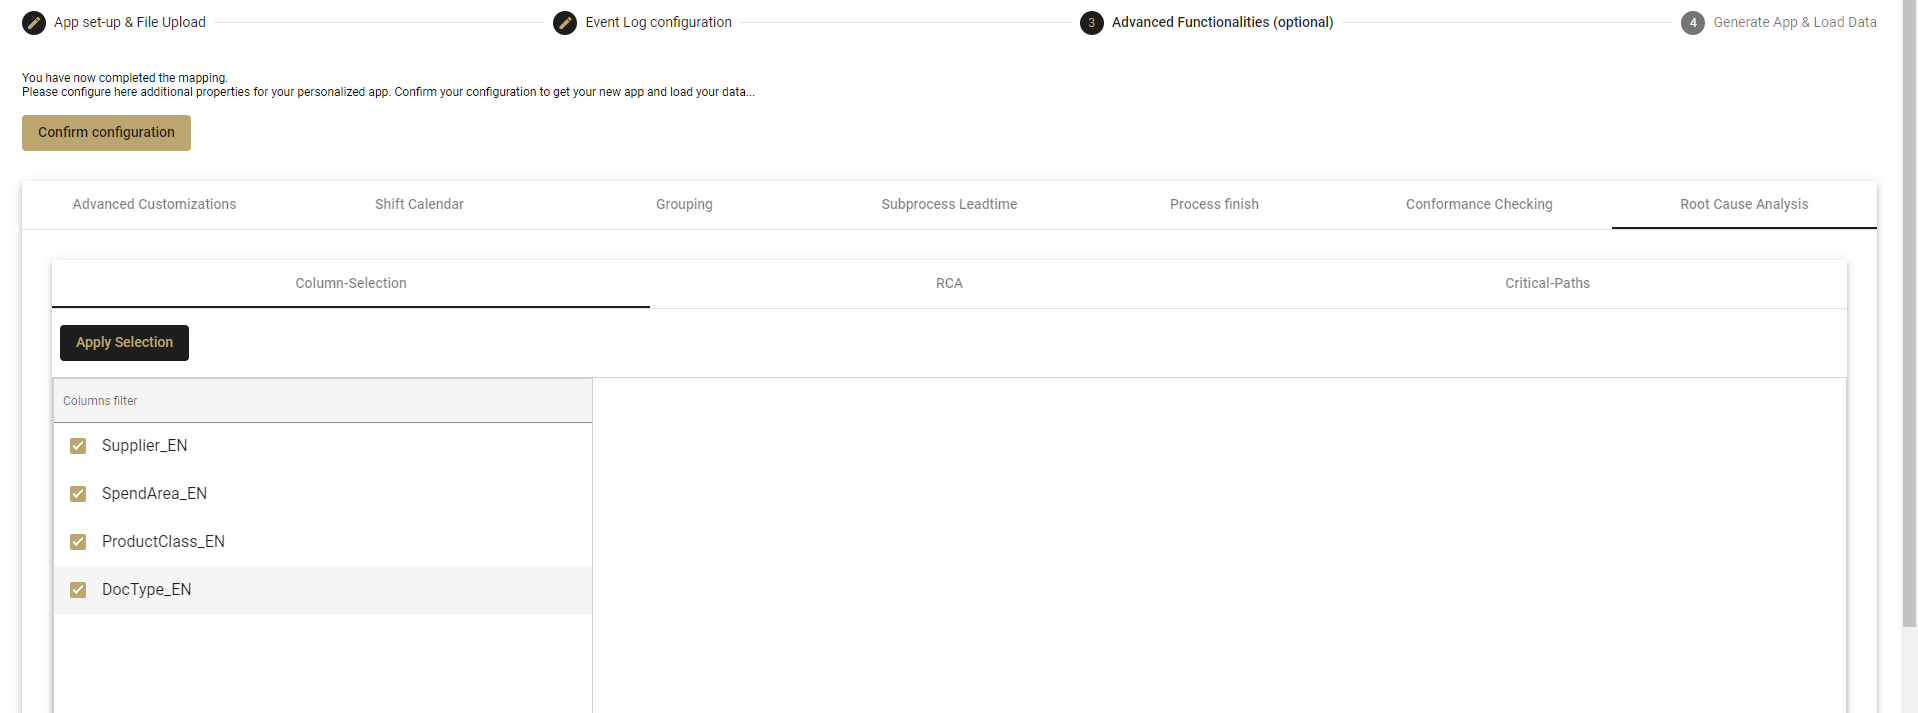
Root Cause Analysis
Use Root Cause Analysis (RCA) to identify the best opportunities for optimizing your process by looking at the worst examples of cases in your process, for example with the lowest automation rate or lowest conformance. RCA also has specific anaylsis options, like Target Idle Time Missed or Target Lead Time Missed.
Root Cause Analysis does not just identify outlying cases, but also identify the optimization targets for these cases, or the case dimension values with the most potential for optimization, such as the cities that are performing the worst or the suppliers associated with the worst cases.
- You are able to measure cases on what is important to you, like a long lead time.
- You able to identify the case dimension values that are most commonly linked with these poor performers.
The Root Cause Analysis tab has three subtabs:
- Column Selection
- RCA
- Critical Paths
Column Selection tab
- Select the case dimensions that you want included in the mpmX RCA analysis. The list come from the columns that were defined in the Event Log Configuration tab.
- This helps you narrow your analysis down to only the target dimensions that provide the most benefit.
- Click on Apply Selection to save your configuration.
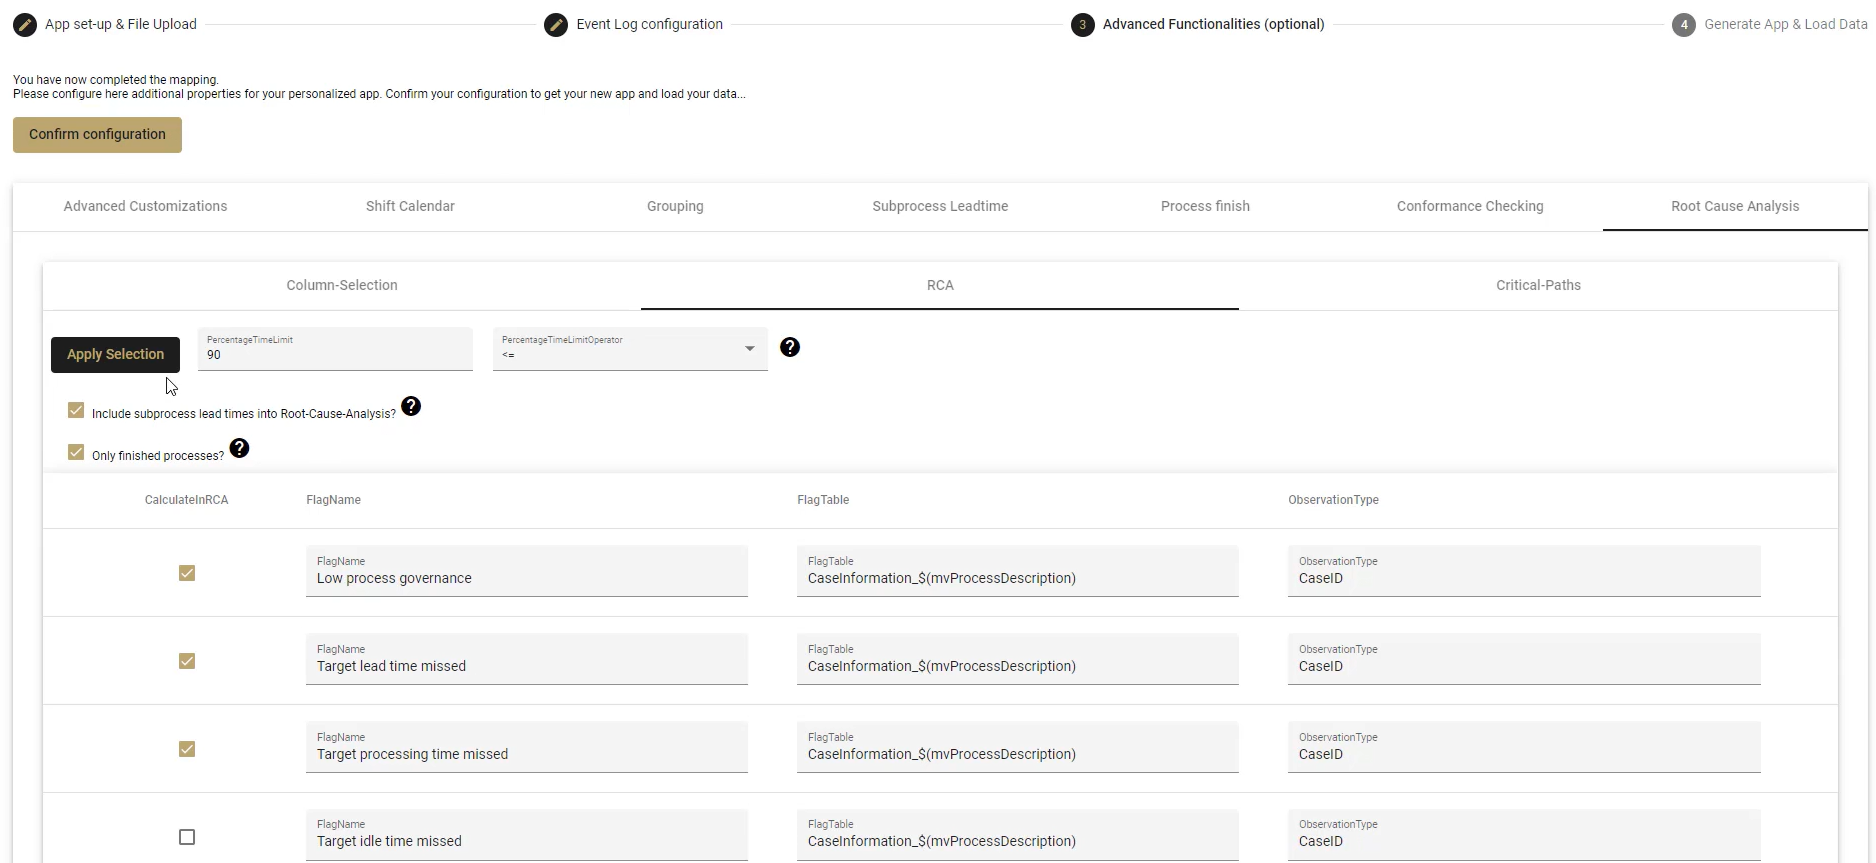
RCA tab
Here you can decide which RCA methods you would like to use.
- Use the checkboxes to select which optimization potentials (FlagName) you would like to have analyzed by the RCA.
- Include subprocess lead times into RCA?
- Check the box if you would like to include optimization potentials based on custom lead times created in the Subprocess Leadtime tab earlier.
- Only finished processes?
- This refers to the variable set on the Process Finish tab.
- PercentageTimeLimit and PercentageTimeLimitOperator
- Select a percentage time limit and operator to set the cut off for which poor performers will be included in the analysis.
- Example: With 90 < selected (the default), the fastest 90% of cases would be considered good and the slowest 10% of cases would be flagged for root cause analysis.
- You could also use the opposite to flag fast cases, if you are interested in where steps may have been improperly skipped. Enter 20 for the PercentageTimeLimit and greater than > for the Operator. This would identify the fastest 20% of cases and mark them for analysis.
- Click on Apply Selection to save your configuration.
Critical Paths tab
Here you can define a custom path called a critical path.
Critical path: Any abnormal or undesired process paths or any specific process path that you want to take a closer look at in your analysis.
- Click Add Path
- Drag and drop activities from the left side to the right and place in the desired order to create the critical path.
- Wildcards
- The [*] means any activity or any number of activities are possible in this position.
- Example: Using an * at the start of your critical path followed by Record Goods Receipt means that the process can start with any number and combination of activities that lead to the Record Goods Receipt activity.
- The [???] allows you to define activities with a specific number
- Example: Having a [12?] in your critical path means that at that point only activities that start with 12 will be considered (120, 121, 122, etc.)
- You can narrow down the focusand exclude certain activities while still having some flexibility.
- The [*] means any activity or any number of activities are possible in this position.
- Click the x next to an activity to delete it from the Critical Path
- Click the x next to the critical path's name to delete the critical path.
- Click Reset all to delete everything and start again.
- Click Apply Critical Paths to finish the Root Cause Analysis setup.
More information on Root Cause Analysis can be found in the Data Engineer Guide.
At this point you could click on Confirm Configuration at the top left to create your app.