Configure Geospatial Process Mapping
If you want to use a graphic such as a factory/shop floor to view your process flow then geospatial process mapping will enable you. You can select points, line strings, polygons and polygon/lines using a coordinate system to highlight various points or parts of your graphic and make them selectable.
Prerequisites
Before getting started you need to have:
- A picture of good resolution
- File share / Webspace (to reference the picture)
- If you use Qlik Sense SaaS, you need to create a "Content Security Policy" for the reference to your image.
General Information
- Geo-points on a map are using latitude and longitude to locate the right spot on a map within the WGS-84 System
- An image doesn’t use this coordinate system
- PNG (Portable Network Graphics) or SVG (Scalable Vector Graphics) as an example are using horizontal and vertical pixels for coordination
- Qlik Sense map object can use this “custom” coordinate system to plot objects on a picture that is used as a background image
- Example: if a picture has 10 x 10 pixels, coordinate [5, 5] would be a point in the center of the image
Steps to set up the Geospatial Process Mapping
-
Open your image with an image editing program (e.g. Microsoft Paint, Inkscape etc.) to determine the pixel size of the image. In our example, the image of our Shopfloor layout has a resolution of 3826 (width) x 2619 (height) pixels.
Download the Example Shopfloor Image
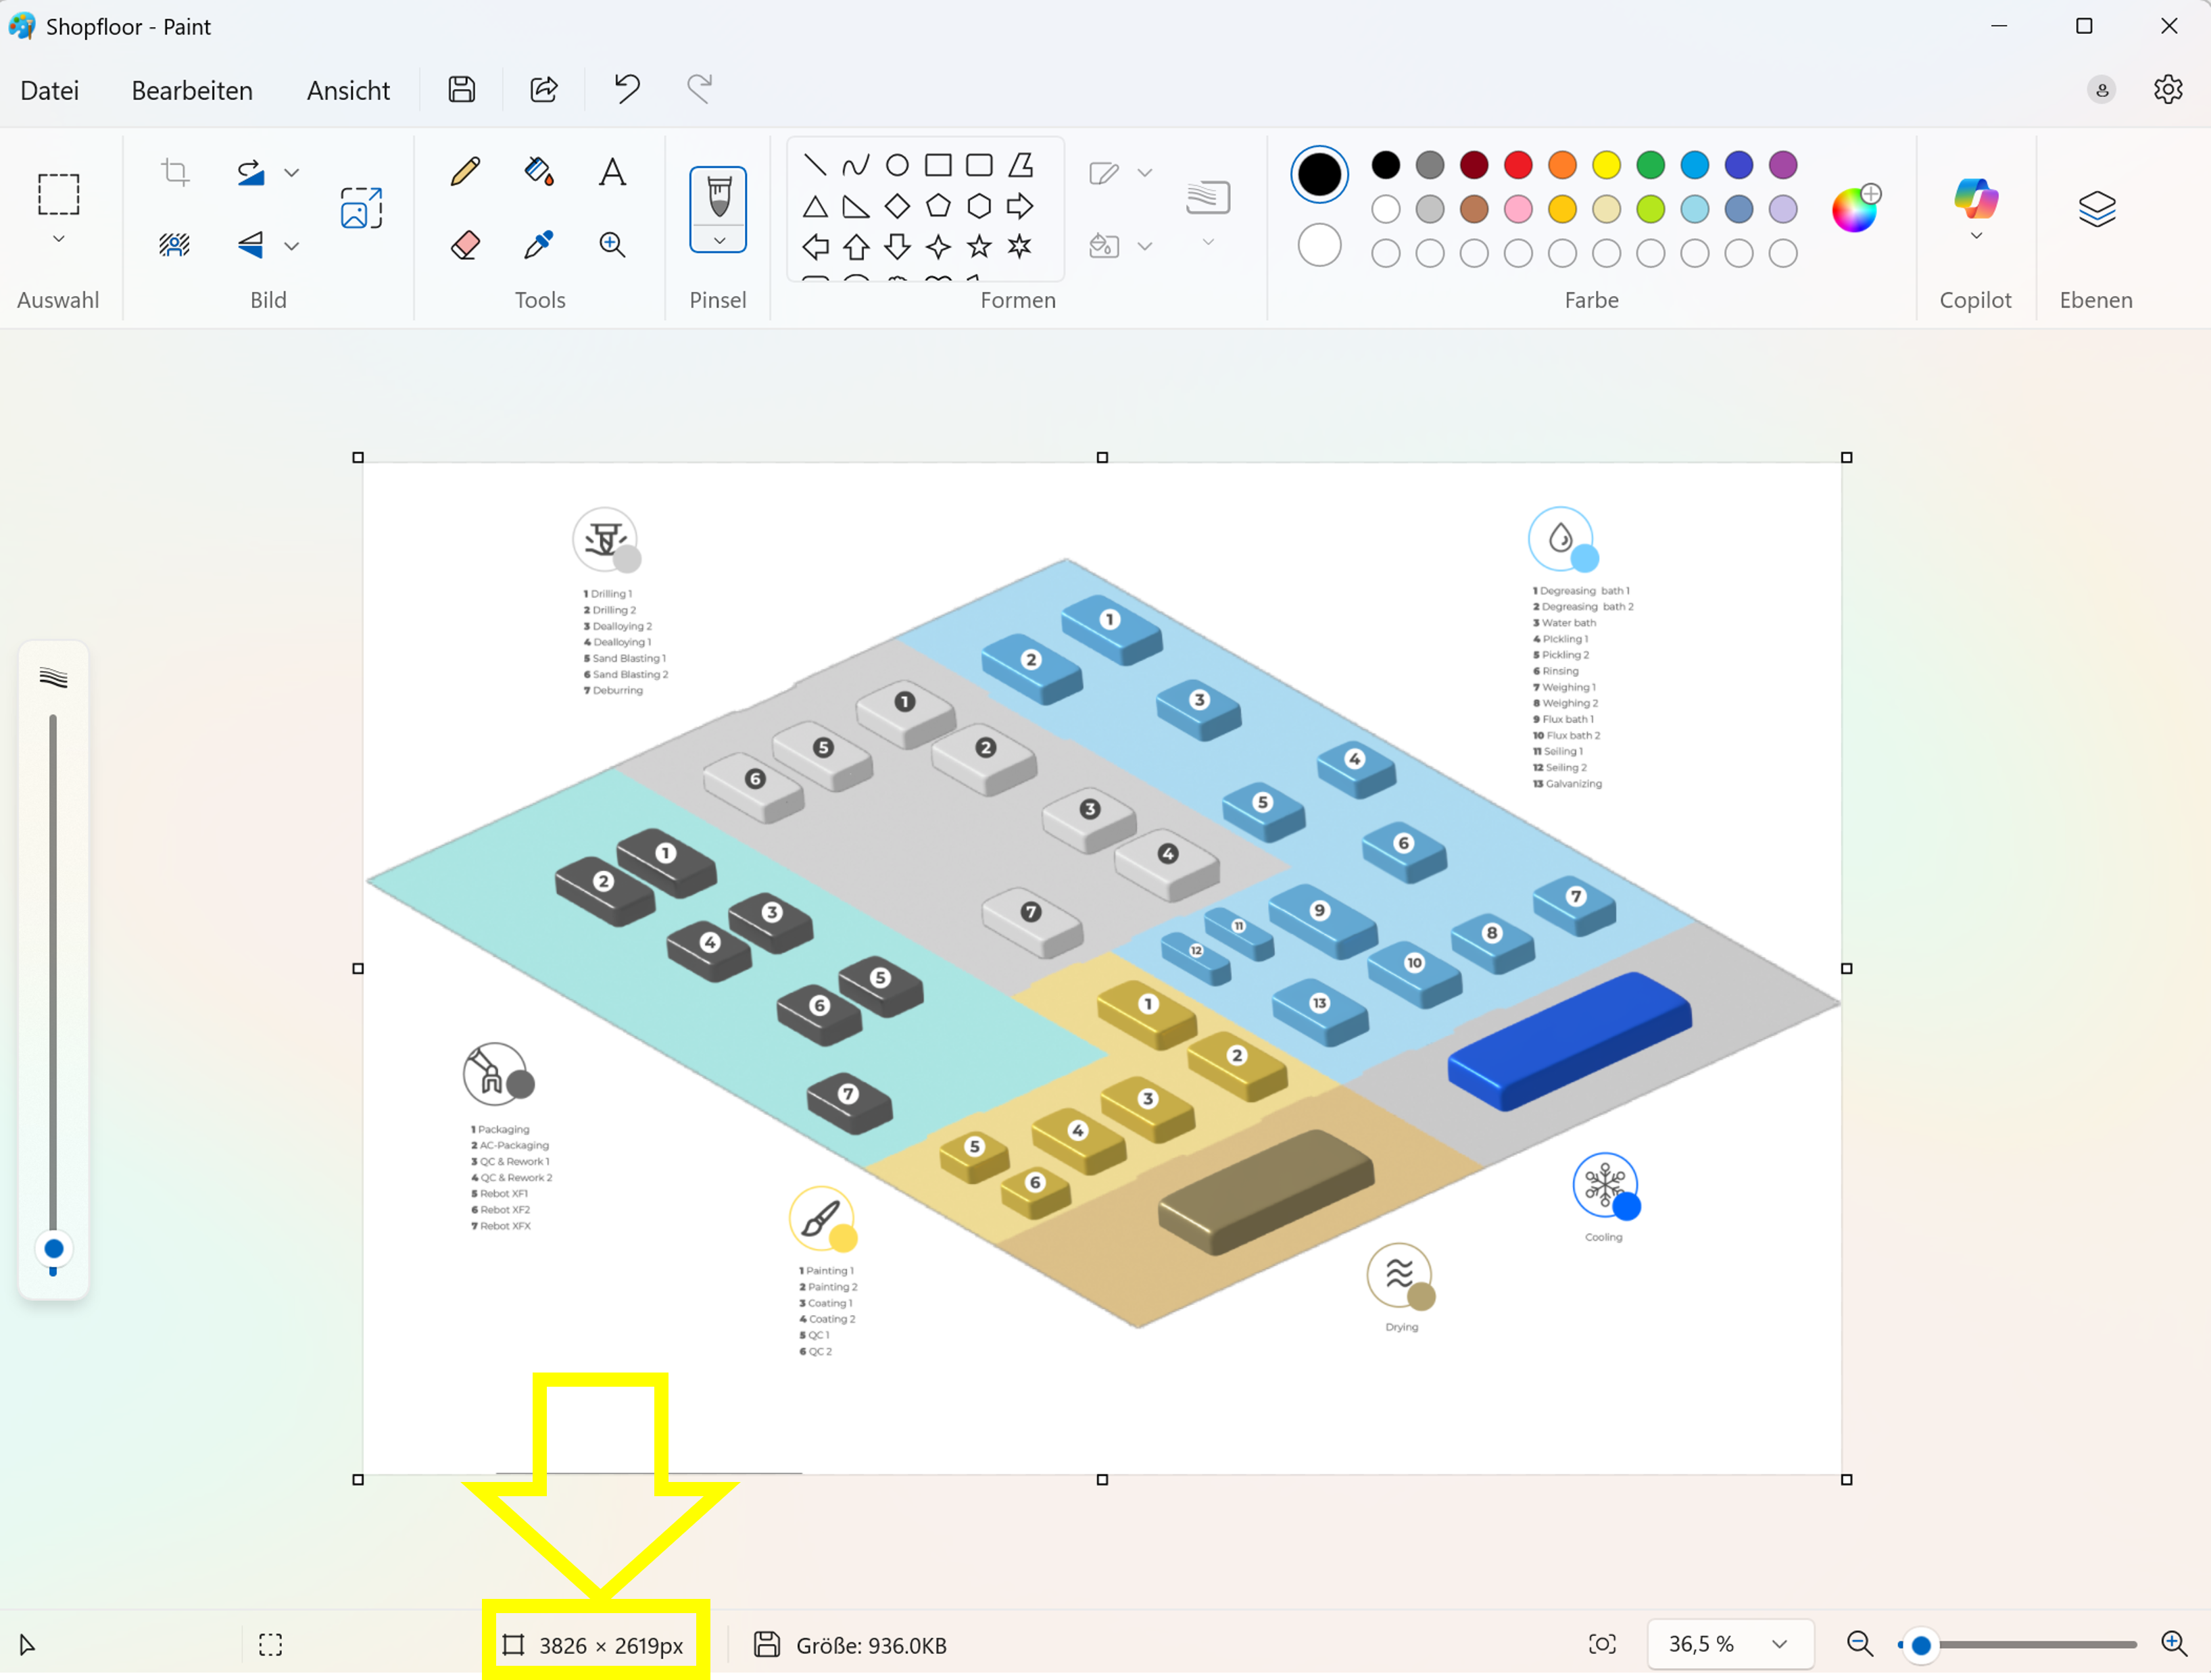
Pixel Size of an Example Shopfloor Image -
Download and open the two attached Excel files. The file Template_Pixel determination From Activity is used to determine the exit points of a resource or station of an activity. The file Template_Pixel determination To Activity, on the other hand, is used to determine the entry points. If no distinction is to be made between entry and exit points, only one of the two files can be selected and filled.
Download Template_Pixel determination From Activity.xlsx
Download Template_Pixel determination To Activity.xlsx
infoAfter downloading, remember to remove the hash value from the file name so that the files remain compatible with the following script examples, etc.
-
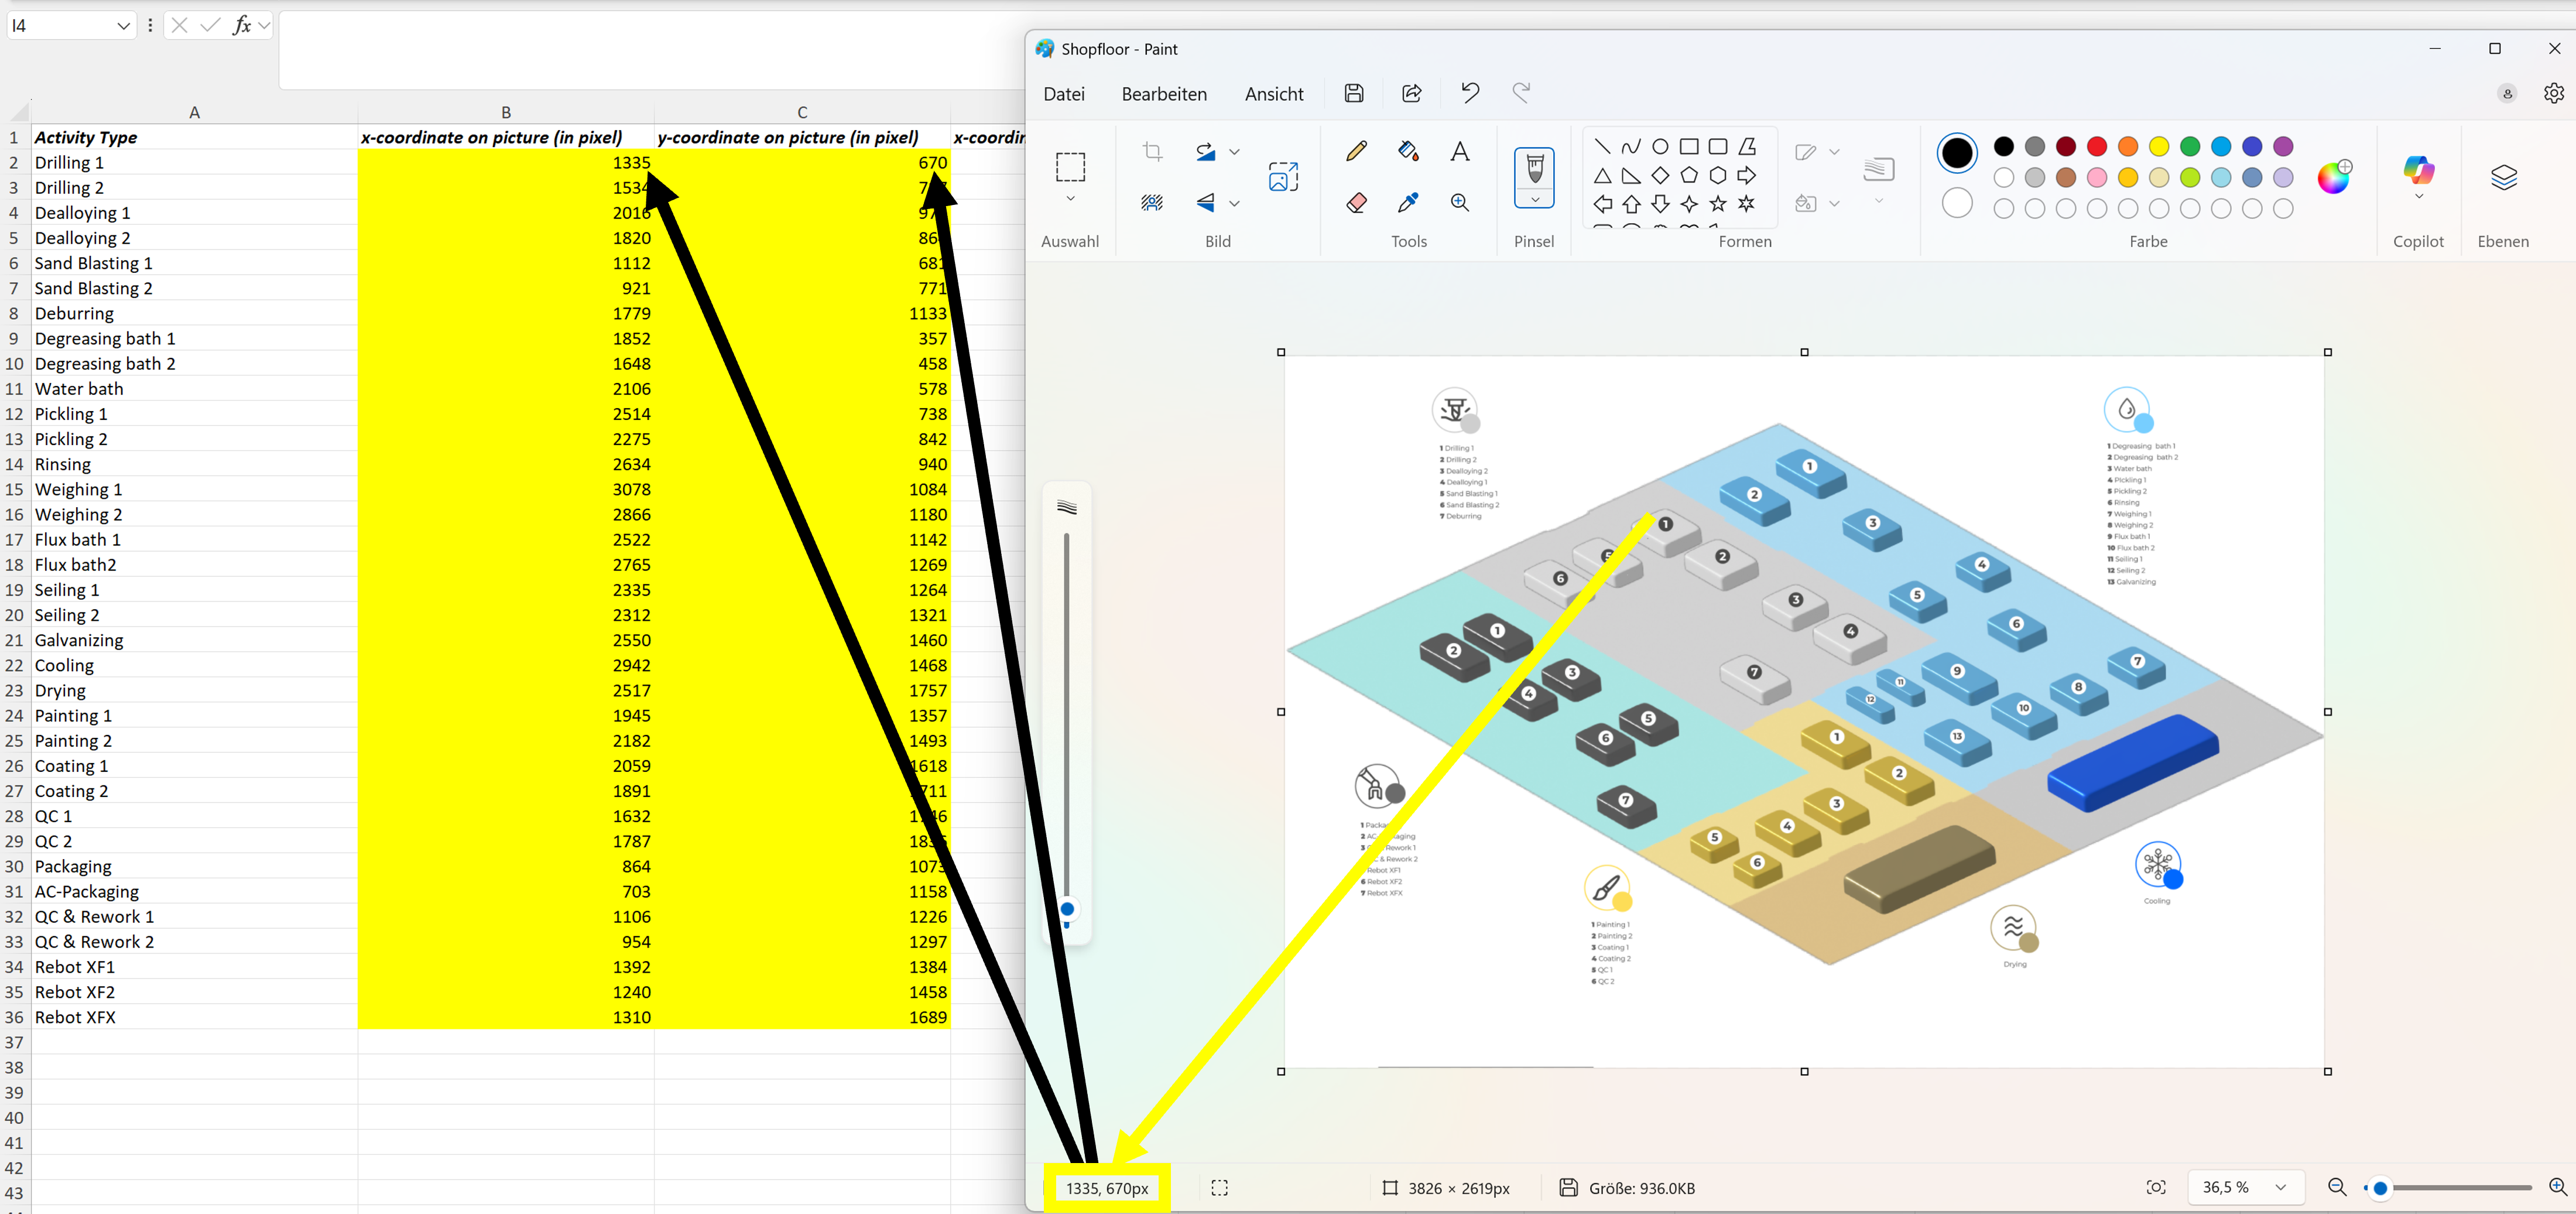
Fill the yellow marked cells "Qlik shifted to the left" with the pixel value for width and the cell "Qlik shifted to bottom" with the pixel value for height read out under point 1.
-
Change the Activity Types in column A to your specific values.
-
Go back to your image editing program. Now hover over the desired entry or exit points of your resources or activity stations and note the respective pixel coordinates (x/y) in columns B and C. Save the files when all points have been created.
Point Mapping -
Load the Excel files into an mpmX TemplateApp via a data connection of your choice. Alternatively, it is also possible to load the coordinates into the app via an inline table. The following script shows a simplified example to check in the first approach whether the points have been properly stored in the coordinate system:
    EntrySteps:
    LOAD
        "Activity Type" as nextActivityType,
        Coordinates  as PointNextActivity
    FROM [lib://mpmX_data/Template_Pixel determination To Activity.xlsx]
    (ooxml, embedded labels, table is Sheet1);


    ExitSteps:
    LOAD
        "Activity Type" as ActivityType,
        Coordinates as Point
    FROM [lib://mpmX_data/Template_Pixel determination From Activity.xlsx]
    (ooxml, embedded labels, table is Sheet1);

exit script; -
After the data has been loaded, go to Analyze > Sheet. Create a new sheet and add a map chart. Click Edit sheet and clik on the map chart to edit its properties.
-
Add a background layer to the map chart and in Data, do the following
infoTo display the desired image in the app, it must either be accessible via an URL on a web server. Alternatively, the image can be stored on the internal server via QMC (content libraries) and accessed via the URL path (/content/Default/example.png). It is also possible to base64 encode the image and store it e.g. as an image/png media type (see screenshot).
- In Format, select Image.
- Set the URL to your desired value.
- Set the Top left corner to 2619 (=your pixel height) for Top (latitude) and -3826 (=your pixel width) for Left (longitude).
- Set the Bottom right corner to -2619 (=your pixel height) for Bottom (latitude) and 3826 (=your pixel width) for Right (longitude).
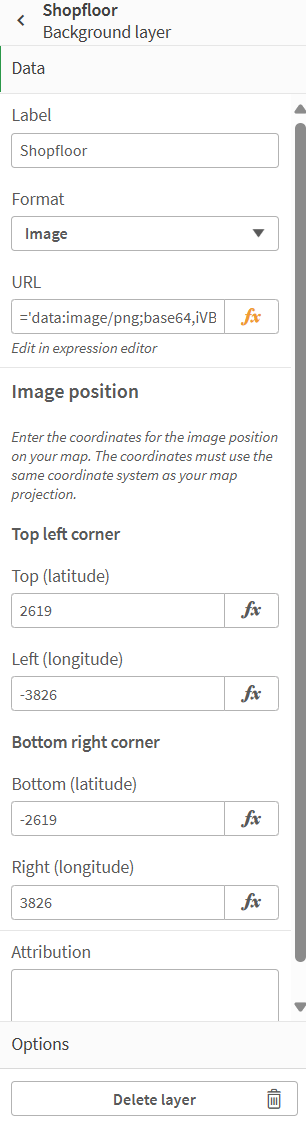
Background Layer
-
Add a first point layer to the map chart and do the following:
- In Data, add ActivityType as the field.
- In Location, set Point as the Location field.
-
Add a second point layer to the map chart and do the following:
- In Data, add nextActivityType as the field.
- In Location, set PointNextActivity as the Location field.
-
To display your image correctly, do the following:
- Go back to the general map chart settings.
- In Map settings, change Base map to None.
- Change Projection to User defined (meters).
- Now your image and the defined points should be displayed correctly. Correct the coordinates in the Excel file if this is not the case and reload the data into the app again.
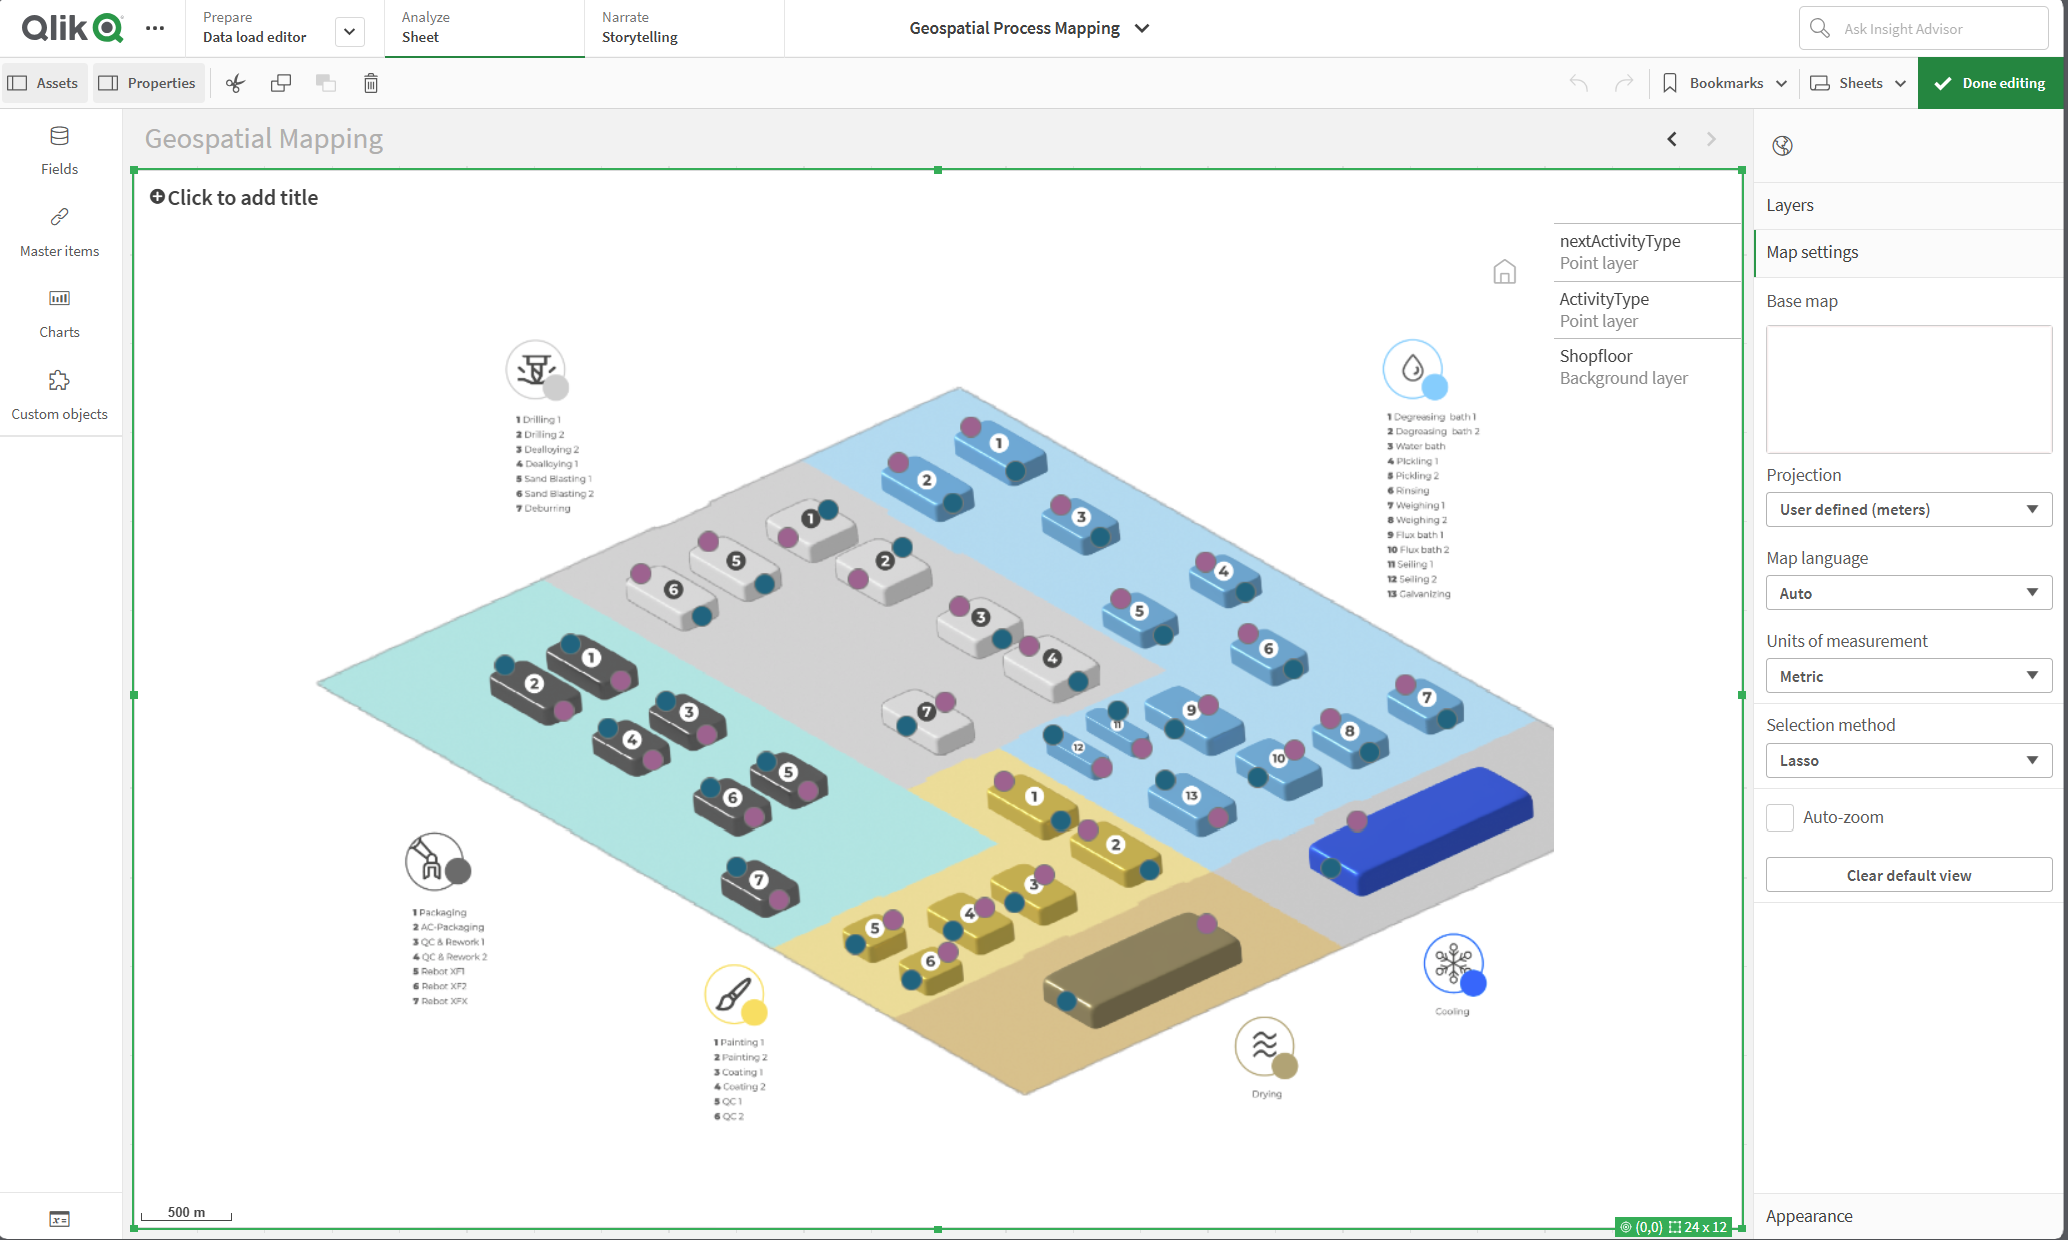
Map Settings
-
To connect the points with the process mining data now, remove the script section from point 6 again, this was only to check the point mapping.
-
Insert the following script part into the app (at the end, after the mining data model) and adapt it accordingly to your Excel/ActivityLog. Load the data again.
left join(pa_activity_log_Resource)
LOAD
    "Activity Type" as Resource_ActivityType,
    Coordinates  as Point
FROM [lib://mpmX_data/Template_Pixel determination From Activity.xlsx]
(ooxml, embedded labels, table is Sheet1);

left join(pa_activity_log_Resource)
LOAD
    "Activity Type" as Resource_nextActivityType,
    Coordinates  as PointNextActivity
FROM [lib://mpmX_data/Template_Pixel determination To Activity.xlsx]
(ooxml, embedded labels, table is Sheet1); -
Go back to your sheet and delete (or hide) the point layers created under points 9 and 10. Add a new line layer to the map chart and do the following:
- In Data, add EdgeType as the field.
- In Location, set Point as Location field (as Start point) and set PointNextActivity as Location field (as End point).
- Various key figures can be used to style the edges. Default for Width by:
avg(aggr(sum({<EdgeType={"=Sum(ActivityCounter)>=$(mvEdgeCounterMin)"}>}ActivityCounter),EdgeType)) - The result should be something like the screenshot below.
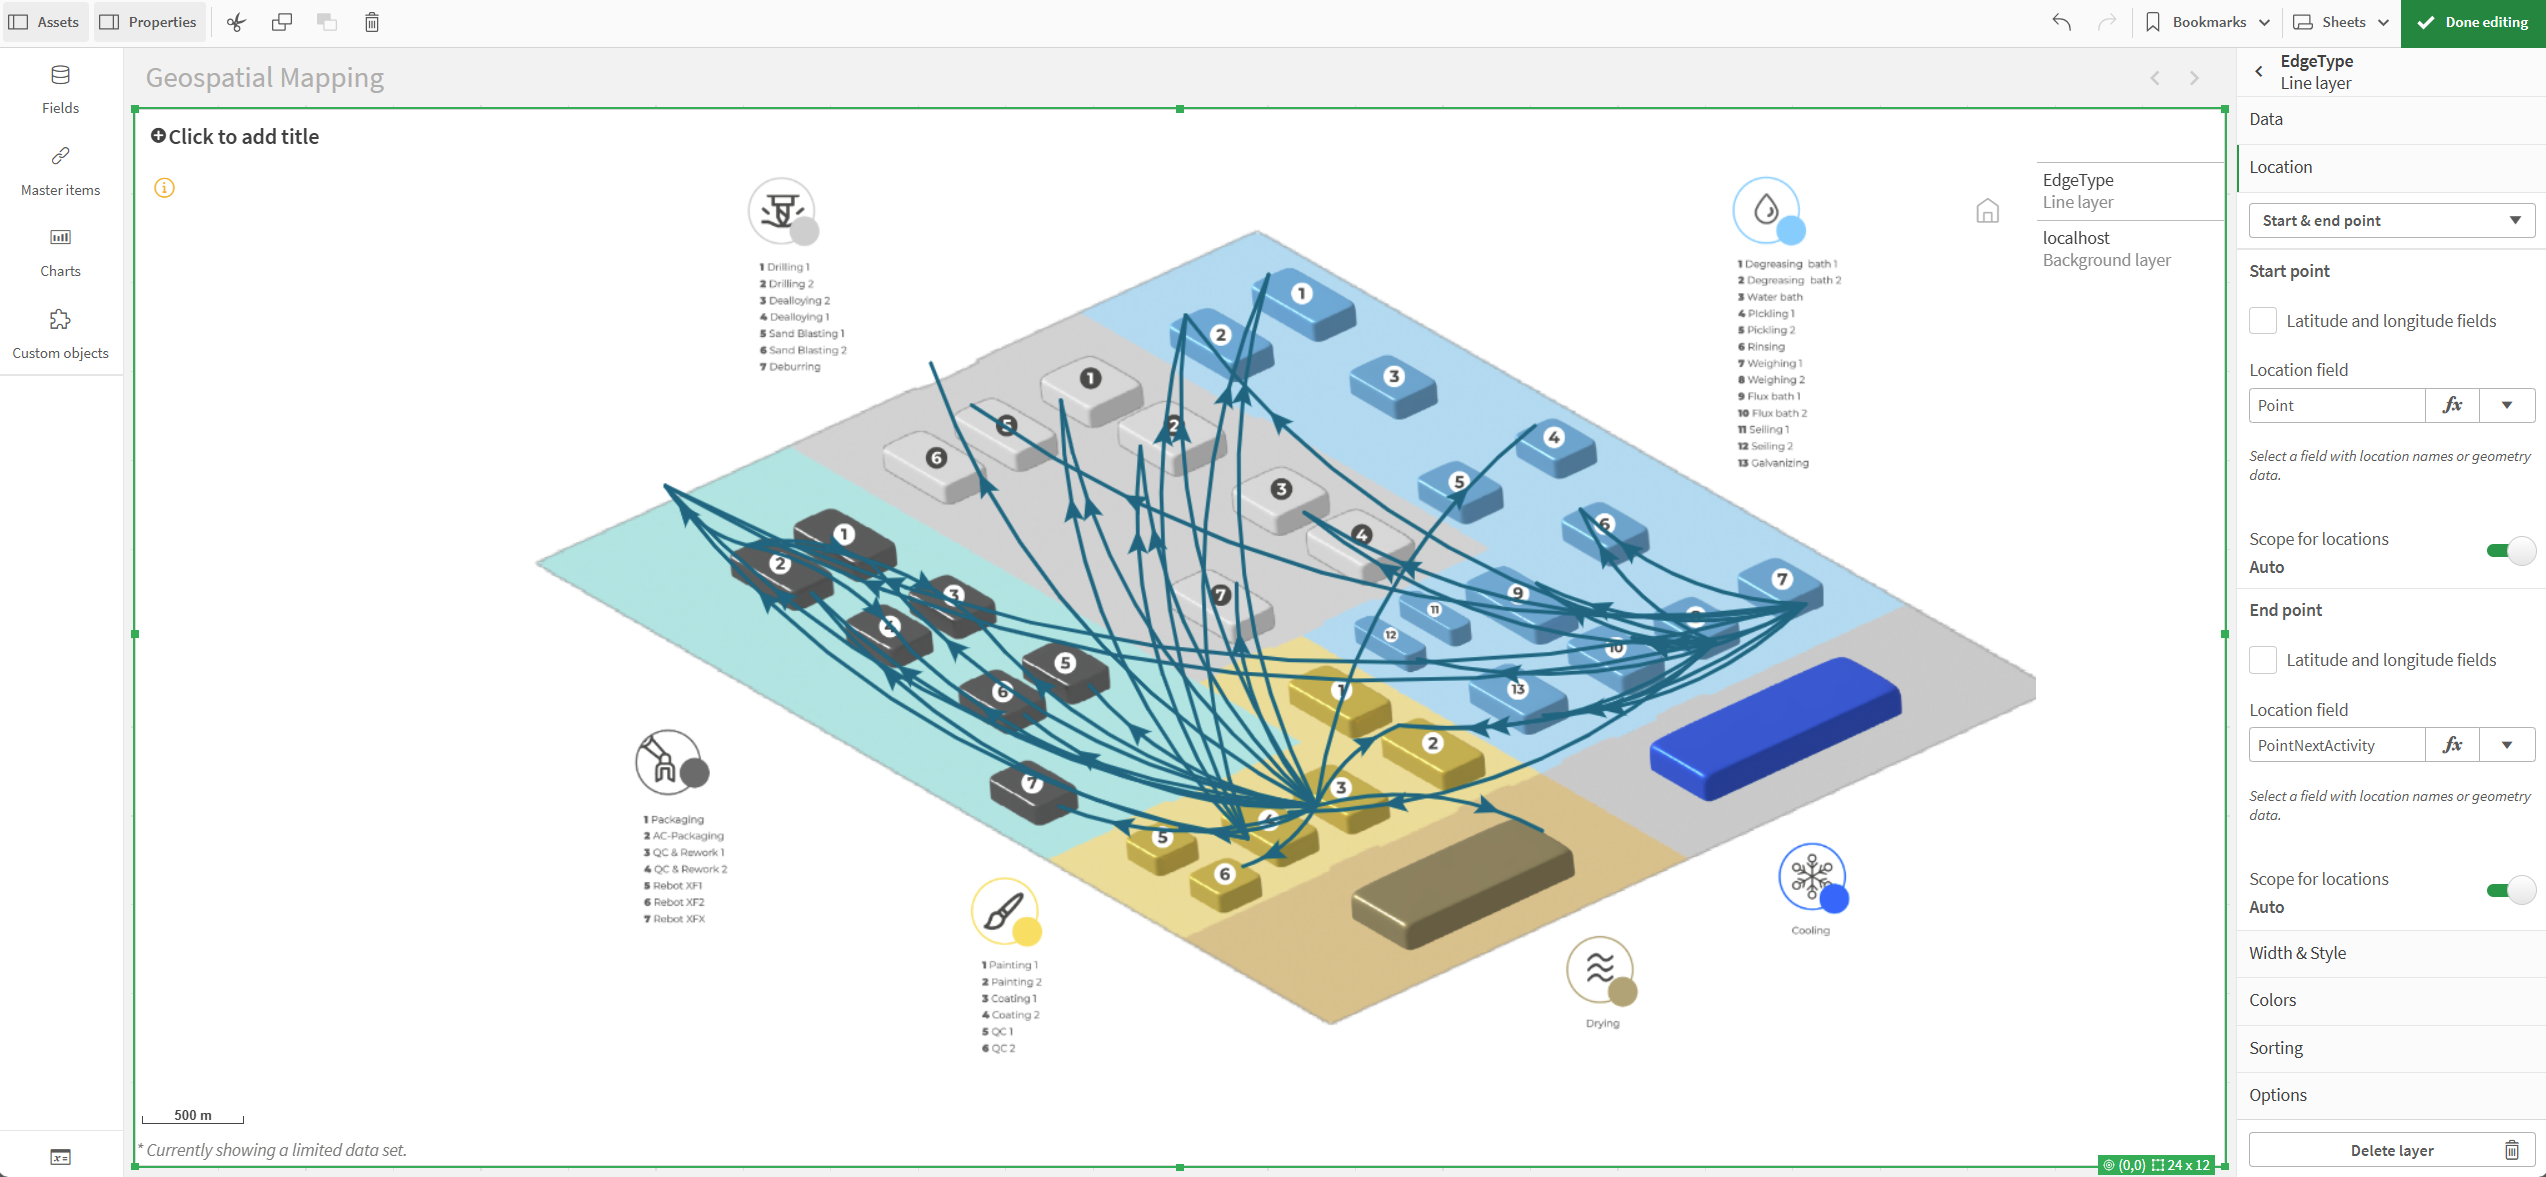
Shopfloor with Line Layer