Case Calculator
mpmX supports various options for calculating relations between values in the visualizations.
Use the brief description below to find your ideal use case.
Example
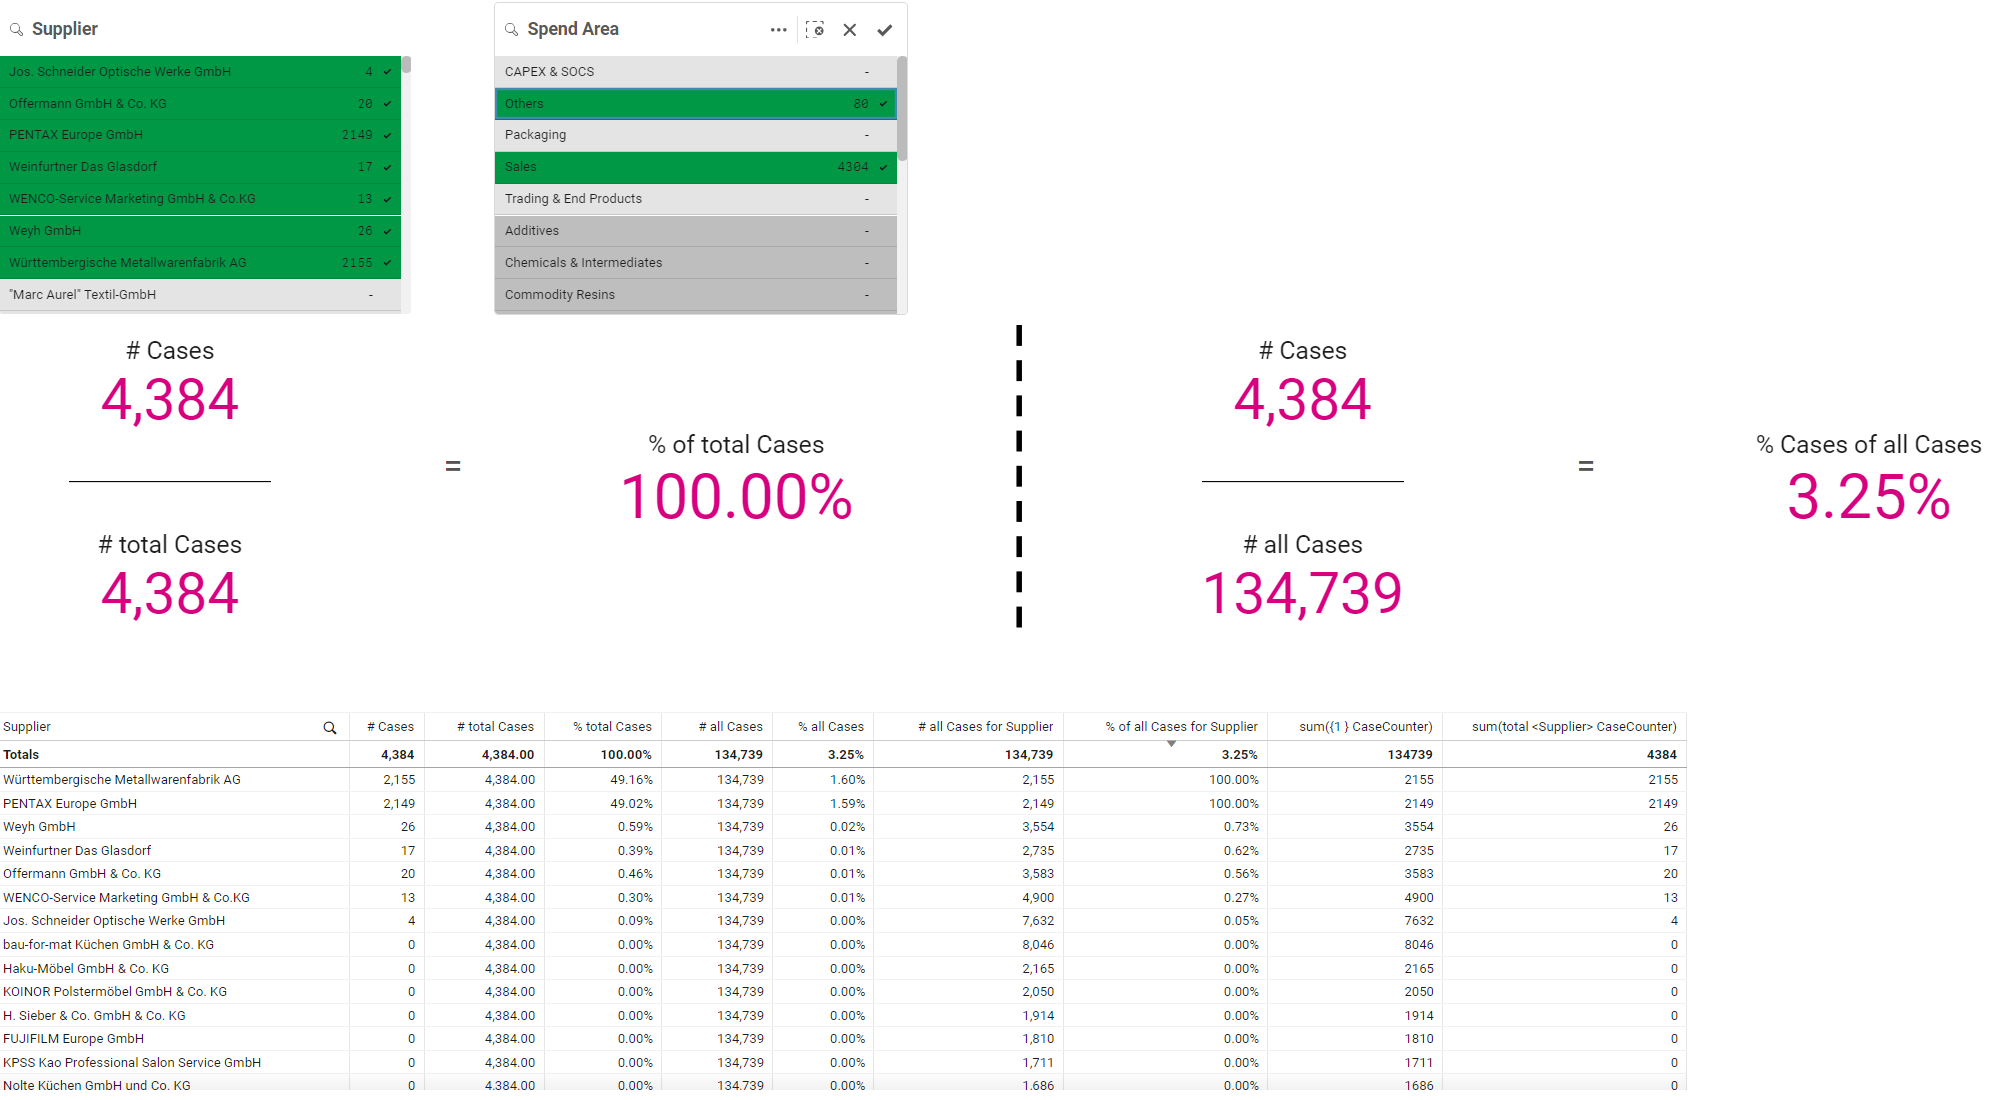
In the picture above mpmX was used to analyze the Purchase-to-Pay process (P2P).
The case dimensions Supplier and Spend Area, at the top of the screenshot, are stored in the purchasing process. Both dimensions have a 1:1 relationship to a case (P.O. item) and are therefore in the CaseInformation table CaseInformation\_$(mv\_ProcessDescription).
The end user now sees the relationship to all cases in a table based on filtering in Spend Area and Supplier. The columns of the table in the screenshot are explained below.
| KPI | Description | Formula | Business Description |
|---|---|---|---|
| # Cases | Counts all cases (process runs). Each filtering restricts the cases displayed. | sum(CaseCounter) | How many cases are contained in the current filter? How many cases are there in the displayed dimensions of a table? |
| # total Cases | Counts all cases that are included in the current filtering, regardless of dimension values | sum(TOTAL CaseCounter) | How many cases are included in the current filter? |
| % total Cases | Calculates the proportion of cases, taking into account the filtering and dimensions of a table, of all cases that are currently being filtered. | sum(CaseCounter) / sum(TOTAL CaseCounter) | What percentage does the dimension value (e.g. Supplier) make up of the current filter? |
| # all Cases | Counts all cases in the entire data model, regardless of filtering and dimensions. | sum(ALL CaseCounter) | How many cases are there in total in the data model, without any filtering? |
| % all Cases | Calculates the proportion of cases, with consideration of filtering and dimensions of a table, from all cases regardless of filtering and dimensions | sum(CaseCounter) / sum(ALL CaseCounter) | How much does the current filtering of all cases account for when compared to the data model without filtering? |
| # all Cases for Supplier | Calculates how many cases for the dimension (here Supplier) in a table without taking filtering into account. | sum({1} CaseCounter) | How many cases were there with the supplier without taking filtering into account? |
| % all Cases for Supplier | Calculates how many cases the current filtering (here for Supplier) makes up of all cases without filtering | sum(CaseCounter) / sum({1} CaseCounter) | How much does the current filtering of all cases with the Supplier account for? |
| # Cases in state1* | Calculates how many cases are filtered in another state1 | Sum({state1} CaseCounter) | How many cases were filtered in State 1? |
| % Cases in state1* | Calculates how much the current selection makes up of the selection in State 1 | sum(CaseCounter) / Sum({state1} CaseCounter) | How much difference does my current filter make to the filtering in State 1? (previous year comparisons, benchmarks, etc.) |
| Additional Analysis | In order to deepen the possibilities of pre-filtering in key figures, further analysis can be carried out here independently of the mpmX data model: |
Here you can find more information on what states are - StateToState Button.
For more info on Set Modifiers - https://help.qlik.com/en-US/sense/2.0/Subsystems/Hub/Content/ChartFunctions/SetAnalysis/set-modifiers.htm