v2.4

Β· 6 min read

New Help Documentation πŸŽŠβ€‹

We are happy to introduce our new mpmX Help Documentation portal with a fresh and modern look & feel and an improved user experience. The new Help Docs can be found at the same url as before: https://help.mpmx.com.

The new mpmX Help Documentation begins with content from the v2.3.0/v2.4.0 release.

Content for all older versions can now be found at: https://help-archive.mpmX.com

Key Improvements​

  • A modern layout & formatting
  • Improved structure and naming of the material for easier navigation
  • New content to fill in knowledge gaps in various areas
  • Advanced search capabilities to easily find any topic in the documentation
  • Quick version switching (going forward)
  • Dark mode option
  • And more…

Whats new: Major Changes for v2.4 by Role​

Algorithm Optimization (Developer/Data Engineer)​

  • We have implemented better modularization so that code is now easier to maintain and customize. New changes are made in the customizing folder. For more information on that you can check out the Folder Structure.

  • We rewrote the algorithms to speed up your workflow, which means high performance mining and less loading time!

  • We implemented performance measuring methods for all Data Engineers.

  • Yes! The model is still compatible with old versions. The generated fields within the data model remain the same.

New Infrastructure (Data Engineer)​

  • Partial loads are now possible! For example, if we want to configure an additional happy path, we can load only the conformance checking logic without mining the whole process. This makes the process more efficient and faster without rebuilding the whole model from scratch.

  • Scripts are now outsourced for better development. This has the big advantage of version management because changes can be tracked. The Data Load Editor version is still supported if you want to stick with it.

New Template App & Master Item Repository (Mainly Business Analyst & Business User)​

  • We have restructured the frontend by using fewer variables within the formulas. This means that customizations now need to be done inside the repository. We have reduced the number of Master Items for better overview and maintenance.

  • We have also reduced the number of visualizations and KPIs to a minimum, which also supports a better overview of the Master Item Repository.

  • Fewer objects in the front end make the App easier to edit and analyze.

  • Due to these changes, Root Cause & Resource Analysis emerged as their own separate sheets. This way you don't have to use variables in every formula which makes it easier to edit.


Fixes & Technical Details πŸ’» πŸ›β€‹

Fix - Grouping | Process Analyzer​

  • Grouping was not working in some constellations and is now available again.
  • OCPM mode now supports groups as well.
  • The mpmXβ€―Groupingβ€―feature allows activities to be grouped together in the mpmX ProcessAnalyzer which simplifies the process graph for analysis.
  • When groups are collapsed you get a higher level overview of the process. You can then expand one or more groups to look into the details.
  • For more information on Grouping visit the article about Enable Grouping
Gif showing grouping in the Process Analyzer

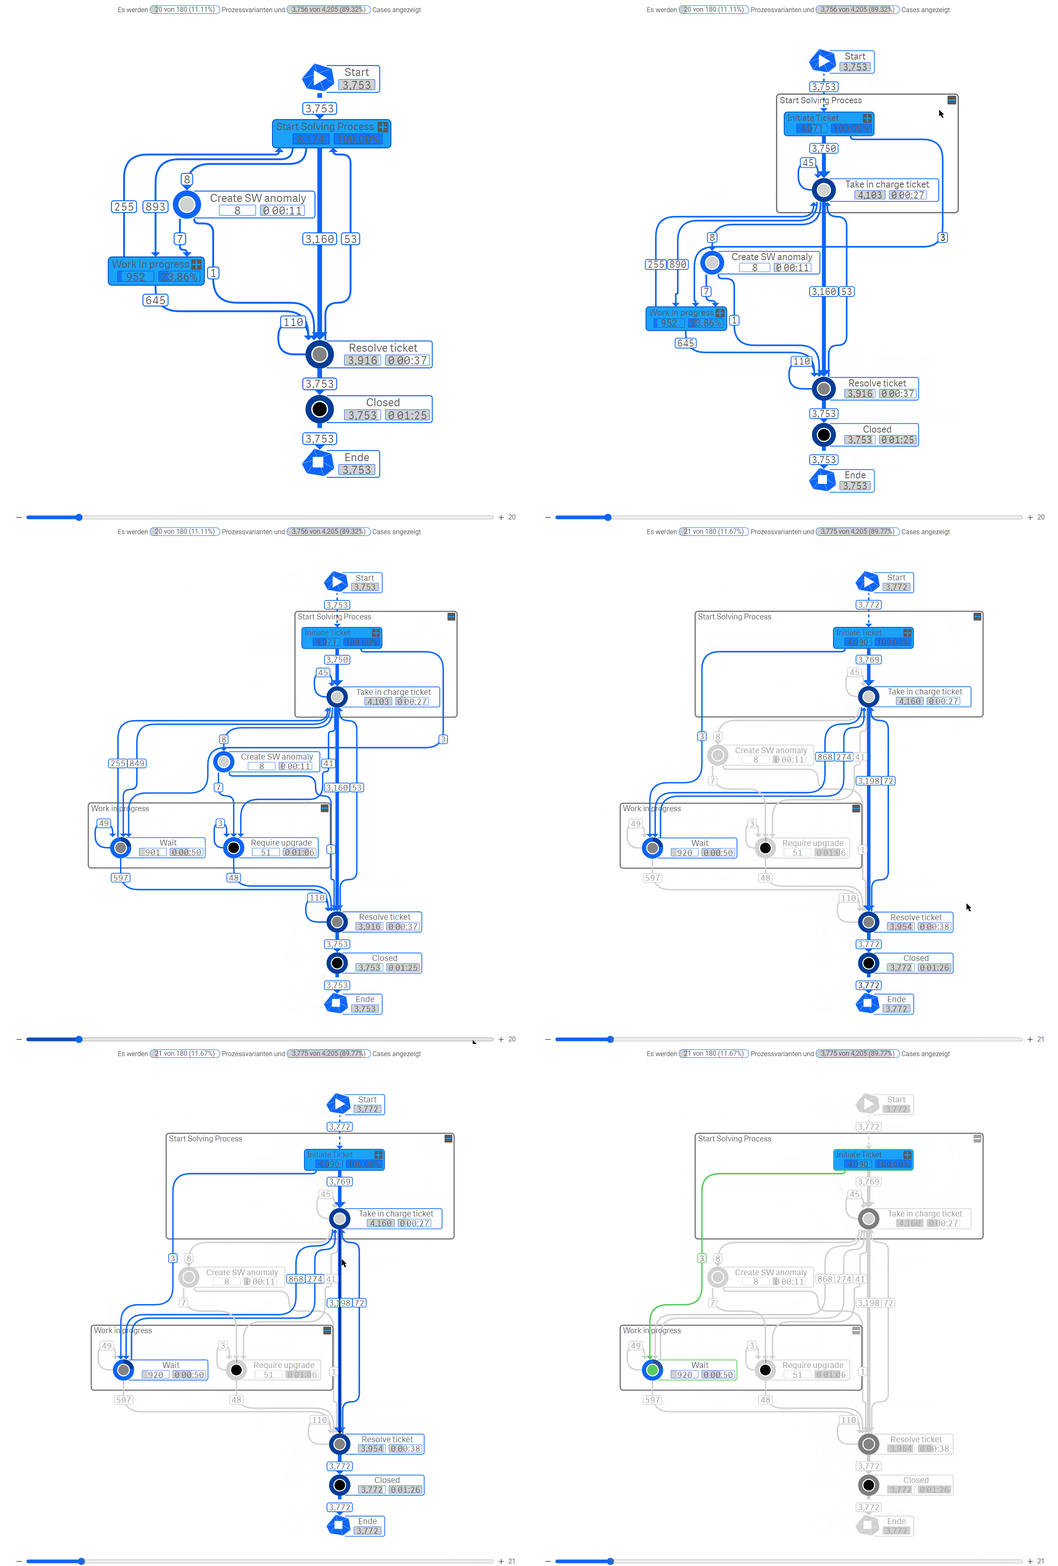
Fix - Path Highlighting | Process Analyzer​

  • Path highlighting was not working in some constellations.
  • The feature creates a better visibility of the additional process variant when using the β€˜+’ Button on the Variants Slider
  • The new variant is colored with the default color of the graph and all remaining nodes and edges (β€œold” variants) are displayed in grey.
  • Additionally, new nodes/edges within the new variant (that didn’t occur before) are highlighted to show what elements were added to the graph.

Technical Details - ChangeLog​

  • Overall performance improvements
  • Separation for API and environment variables
  • qvd-builder template for SAP changelog
  • Excel replace expression for variable expansion in excel config tables
  • New preconfigured alternative folder structure
  • Renamed mpmX_pm_loadProcessAnalyticsModel to mpmX_pm_loadAnalyticProcessModel
  • Various bug fixes - for more details see the Changelog.md

Summary of v2.3.0 πŸ“‹β€‹

The current v.2.4 release is a minor update to the major v2.3.0 update that occurred in Feb. 2024 in the previous documentation format. A summary of the v.2.3.0 release is found below.

The previous Help Documentation is still available under a new url and can now be found at https://help-archive.mpmx.com/.

Refactoring of Scripts and Template Apps​

  • Refactoring improves overall speed and easier maintenance
  • Scripts have improved Modularization
  • Easier to customize and extend
  • Performance improvement in mining
    • Optimization of the processing sequence
    • Summary of calculation steps
    • Reduction in the number of in-memory reloads of the event/process log
    • Optimization of the pareto implementation
    • Optimization of the preparation of multilingual report labels and the handling of multilingual content in the model

App Overview​

  • We now have two new toolsheets: The Resource Analysis Sheet and the Root Cause Analysis Sheet which derive from:

    • The Root Cause Analysis, which was previously implemented in the toolbar.
    • The Resource Analysis which was combined with the Process Discovery via a Toggle-Button -Important for Business Users:
  • We experienced that most of our Users dont need as many tools as there were provided in the last versions.

  • Therefore the Toolbar moved upwards and is now reduced to:

    • Process Analyzer
    • Activity Filter
    • Process Pattern Search
    • Lead Time Filter
    • Process Variants Inspector
  • This Toolbar can be adapted, and so can be everything on the sheets in case your missing something.

Process Analyzer​

  • Process Analyzer leaves beta status and can now be used in productive environments.
    • Unprecedented Speed: Experience graphical analysis of your processes, enabling you to identify opportunities for improvement faster than ever.
    • New Framework: Nebula.js which delivers much faster results

Business Apps​

  • New Business Apps are now available.
  • Use OOTB Business Value in these Business Cases:
    • ITSM (matrix42)
    • D.3 Invoice
    • Banking (for finance customers)

OpenAI Analytics Connector​

  • OpenAI Analytics Connector provides real-time access to generative content in mpmX.
    • Admins can securely integrate natural language insights from OpenAI into analytics apps.
    • The connector allows synthesis and combination of third-party data into existing data models, directly ask questions of ChatGPT augmented with data from Qlik, and much more.
  • The Qlik analytics engine can be configured to send subsets of data to OpenAI in real time for insights and answers in context as users make selections.

New Table Diagram (Platform Feature)​

  • The Table diagram was updated and offers new visualizations.
    • App users can flexibly choose table display, add and adjust multiple fields simultaneously.
    • App creators can customize columns, add alternative dimensions and metrics.
    • Settings like column width, pagination, and chart review activation are possible.
    • Users without editing rights can customize the table chart in analysis mode.
    • Customizations include adding/removing columns, changing sort order, and making selections.
    • Particularly useful in apps viewed by numerous users with diverse requirements.