Use Root Cause Analysis (RCA) on Your Data
The root cause analysis enables you to find reasons for certain optimization potentials in single process instances. This mpmX module is optional, but when used it unlocks the analytics in the sheet Root Cause Analysis.
Optimization Potentials
mpmX root cause analysis provides a set of 8 optimization potentials that are by default derived due to the mpmX algorithms. These are:
-
Low process governance = processes with a process governance below a defined threshold
-
Target lead time missed = processes with a lead time above or below a defined threshold
-
Reworked Case = processes that contain at least one rework activity
-
B-Activity Case = processes that contain b-activities
-
C-Activity Case = processes that contain c-activities
-
Low automation rate = processes with an automation rate below a defined threshold
-
Target processing time missed = processes with a summed processing time (event duration) above or below a defined threshold
-
Target idle time missed = processes with a summed waiting time above or below a defined threshold
Furthermore, the Root Cause Analysis offers to analyze:
-
critical process behavior detected by process query (see section Process Pattern Search)
-
optimization potential custom lead times (depending on the threshold value),
-
customized optimization potential (see section How to Perform Root Cause Analysis on Custom Process Optimization Potentials).
Performing the Root Cause Analysis
Performing root cause analysis for your mpmX Template App requires only a few simple steps:
- Go to your mpmX installation path on your file system. Open the file mpmX_repository/[mvProcessDescription]/mpmX_config_repository.qvs
-
Define dimensions and attributes for the root cause analysis by adapting the inline table RootCauseAnalysisDimensions.
These dimensions will then be compared with the occurrence of optimization potentials and marked as an optimization target or not. The following code snippet shows relevant dimensions of a P2P process as an example. You can see that the different field names (dimensions) are entered as rows in the inline table.
P2P example:
RootCauseAnalysisDimensions:
LOAD * INLINE
[ DimensionName
  Company
  DocType
  ProductClass
  Supplier
];infoAll dimensions that you want to check with the RCA must be together in one table which includes the CaseID. By default, the dimensions relevant to the RCA should be stored in the CaseInformation_$(mvProcessDescription) table. This can be seen in the mpmX variable
mvRCADimensionTable:Let mvRCADimensionTable = 'CaseInformation_$(mvProcessDescription)';In rare cases this underlying table could be changed by overwriting the
mvRCADimensionTablevariable.
-
Select the default optimization potentials that should be considered.
The default optimization potentials are listed in the following inline table. To incorporate them into the root cause analysis, set the first colum CalculateInRCA to "y" for yes or "n" for no.
warningAdapt only the first column with "y" or "n", but do not change the entries in the inline table else-wise.
RootCauseAnalysisFlags:
LOAD * INLINE
[CalculateInRCA,  FlagName,                         FlagTable,                                 ObservationType,  RelatedSheet
y,                Low process governance,           CaseInformation_$(mvProcessDescription),   CaseID,
y,                Target lead time missed,          CaseInformation_$(mvProcessDescription),   CaseID,
y,                Reworked Case,                    CaseInformation_$(mvProcessDescription),   CaseID,
y,                B-Activity Case,                  CaseInformation_$(mvProcessDescription),   CaseID,
y,                C-Activity Case,                  CaseInformation_$(mvProcessDescription),   CaseID,
y,                Low automation rate,              CaseInformation_$(mvProcessDescription),   CaseID,
n,                Target processing time missed,    CaseInformation_$(mvProcessDescription),   CaseID,
n,                Target idle time missed,          CaseInformation_$(mvProcessDescription),   CaseID,
];
-
Set the threshold for optimization of too fast or too slow cases
Define which percentage of cases will be analyzed regarding the time missed optimization potentials.
To do so, perform the following steps:
-
Open the file mpmX_scripts/[[version]]/customizing/[mvProcessDescription]/custom_variables.qvs.
-
Set a value to the variable
mvPercentageTimeLimitwhich indicates the percentage of cases that will be analyzed by the root cause analysis, regarding the time missed optimization potentials.
SET mvPercentageTimeLimit = 0.9; -
Define an operator which indicates whether the values should be above or below the
mvPercentageTimeLimit. The possible operators are<,<=,=,>and>=.
SET mvPercentageTimeLimitOperator = <;
Setting the variables like in the example above, the default, shows the fastest 90% of cases which are considered good and the slowest 10% of cases would be flagged for root cause analysis.
You could also use the opposite to flag fast cases, if you are interested in where steps may have been improperly skipped. Enter '0.2' for the
mvPercentageTimeLimitand greater than>for themvPercentageTimeLimit. This would identify the fastest 20% of cases and mark them for analysis. -
-
Set the threshold for automation rate optimization potentials.
Define which cases will be analyzed regarding the automation optimization potential. To do so, perform the following steps:
- Open the file mpmX_scripts/[[version]]/customizing/[mvProcessDescription]/custom_variables.qvs.
- Set a value to the variable
mvPercentageAutomationLimitwhich indicates the percentage of automated events that a case needs to have to be labeled as a well automated case. If the automation rate for the case is lower, the root cause analysis will analyze the case regarding the "missed" automation potentials and their context.
SET mvPercentageAutomationLimit = 0.5;
-
Set the threshold for optimization of the process governance
Define which percentage of cases will be analyzed regarding the process governance optimization potential.
- Open the file mpmX_scripts/[[version]]/customizing/[mvProcessDescription]/custom_variables.qvs.
- Set a value to the variable
mvProcessGovernanceOptimizationThresholdwhich indicates the conformance threshold to the desired process model / happy paths.
SET mvProcessGovernanceOptimizationThreshold = 0.8;Setting the variable like in the example above, the default, means that cases with more or equal than 80% process conformance (= Happy Path Fitness) are considerd good and cases with less than 80% process conformance would be flagged for root cause analysis, regarding the "missed" conformance to the given process model / happy paths.
-
Use the
mvRCAForFinishedProcessOnlyvariable to decide whether the RCA should calculate relationships between optimization potentials and the process context for only closed or for all cases.- Open the file mpmX_scripts/[[version]]/customizing/[mvProcessDescription]/custom_variables.qvs.
- Set a value to the variable
mvRCAForFinishedProcessOnly. The default value is 1, which means that the relationship is calculated only for closed cases. This makes sense e.g. regarding lead times, because open processes will clearly have a shorter lead time and thus could misrepresent process contexts that trigger a high (or low) lead time.
LET mvRCAForFinishedProcessOnly = 1;
-
Optional: Define critical process paths by queries to explain their occurrence.
By adding lines to the following inline table, cases which follow the critical process variant will be marked and the reasons for this critical deviation will be extracted from the data. To do so, perform the following steps:
-
Open the mpmX Extension ProcessPatternSearch inside your mpmX TemplateApp and define a critical process query (see section ProcessPatternSearch Properties Panel). Assemble your desired critical process pattern via drag and drop. Finally, copy the resulting process query.
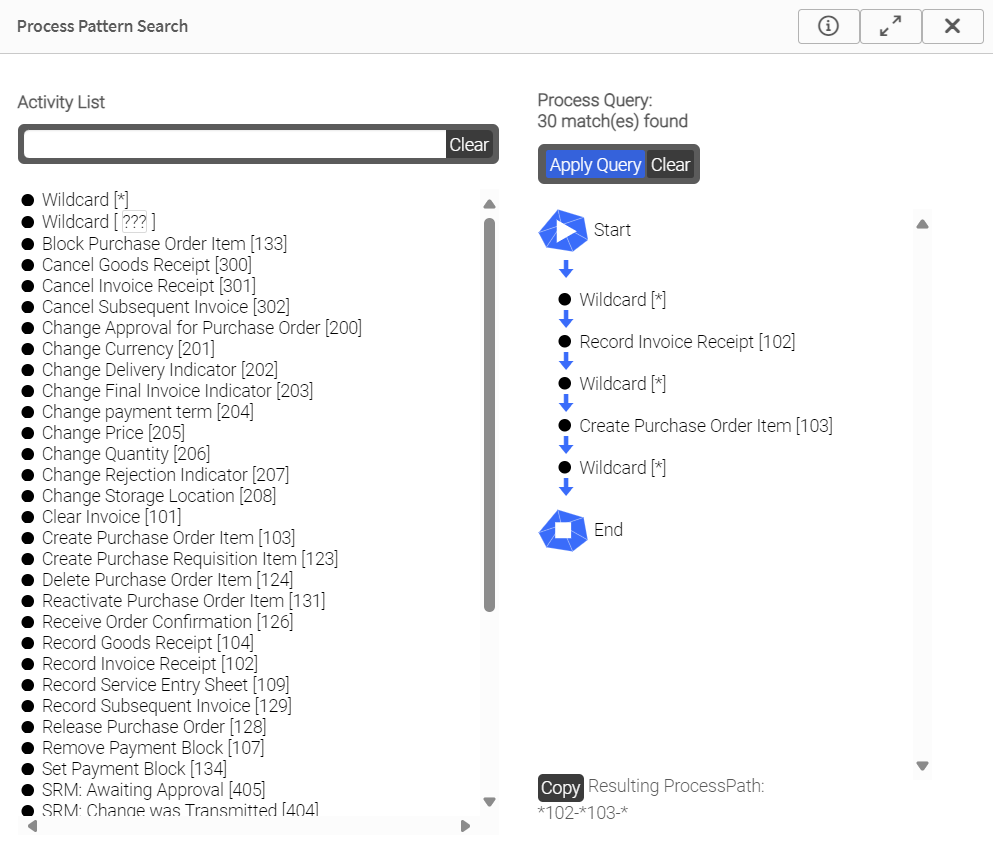
Process Pattern Search Critical Path Query -
Open the file mpmX_repository/[mvProcessDescription]/mpmX_config_repository.qvs and paste the proceess query into the first column CriticalPathQuery of the table [CriticalQueries_$(mvProcessDescription)].
-
Give it a unique and clear FlagName, as the name will be displayed as the problem description in the root cause analysis' front end.
-
If you do not want to employ this type of analysis, just delete the rows from the inline table.
[CriticalQueries_$(mvProcessDescription)]:
noconcatenate
load * inline
[CriticalPathQuery,  CriticalPathFlagName,   CriticalPathRelatedSheet
 *102-*103-*,        Maverick Buying,
]; -
-
Optional: Explain too long or too slow custom lead times
By editing the variable
mvCustomLeadTimeInRCA, you can control whether defined subprocess lead times are considered within the RCA. Setting the variable to "1" means, that you want to include optimization potentials based on custom subprocess lead times.If you want to learn more about configuring subprocesses, please have a look at the section Define Subprocesses in the mpmX EventLogGeneration Apps
LET mvCustomLeadTimeInRCA = 1;infoSetting values for TargetTime and TargetTimeOperator in your sub-process definition as in the example below, all cases with a subprocess runtime greater than or equal to 60 days are marked as delayed cases and would be flagged for root cause analysis.
SubprocessDefinition_$(mvProcessDescription):
Load * Inline [
Qualifier,         StartActivity,                               IncludeStartActivity,   MinMaxStartActivity,    EndActivity,    IncludeEndActivity,     MinMaxEndActivity,  TargetTime,     TargetTimeOperator
Payment Process,   Record Service Entry|Record Goods Receipt,   y,                      Max,                    Pay Invoice,    n,                      Min,                60,              <
];
If no values are set for TargetTime and TargetTimeOperator in your sub-process definition, the variables
mvPercentageTimeLimitandmvPercentageTimeLimitOperator(see step 4) will take effect. This means, for example, that setting the variables tomvPercentageTimeLimit = 0.9andmvPercentageTimeLimitOperator = <, means that the 90% of the fastest subprocess runs are considered good and the slower 10% of the subprocess runs are marked as delayed cases and would be flagged for root cause analysis.
- Finally, relaod your data so that the mpmX root cause analysis alogrithms are called and the Root Cause Analysis sheet is displayed after a successful reload.