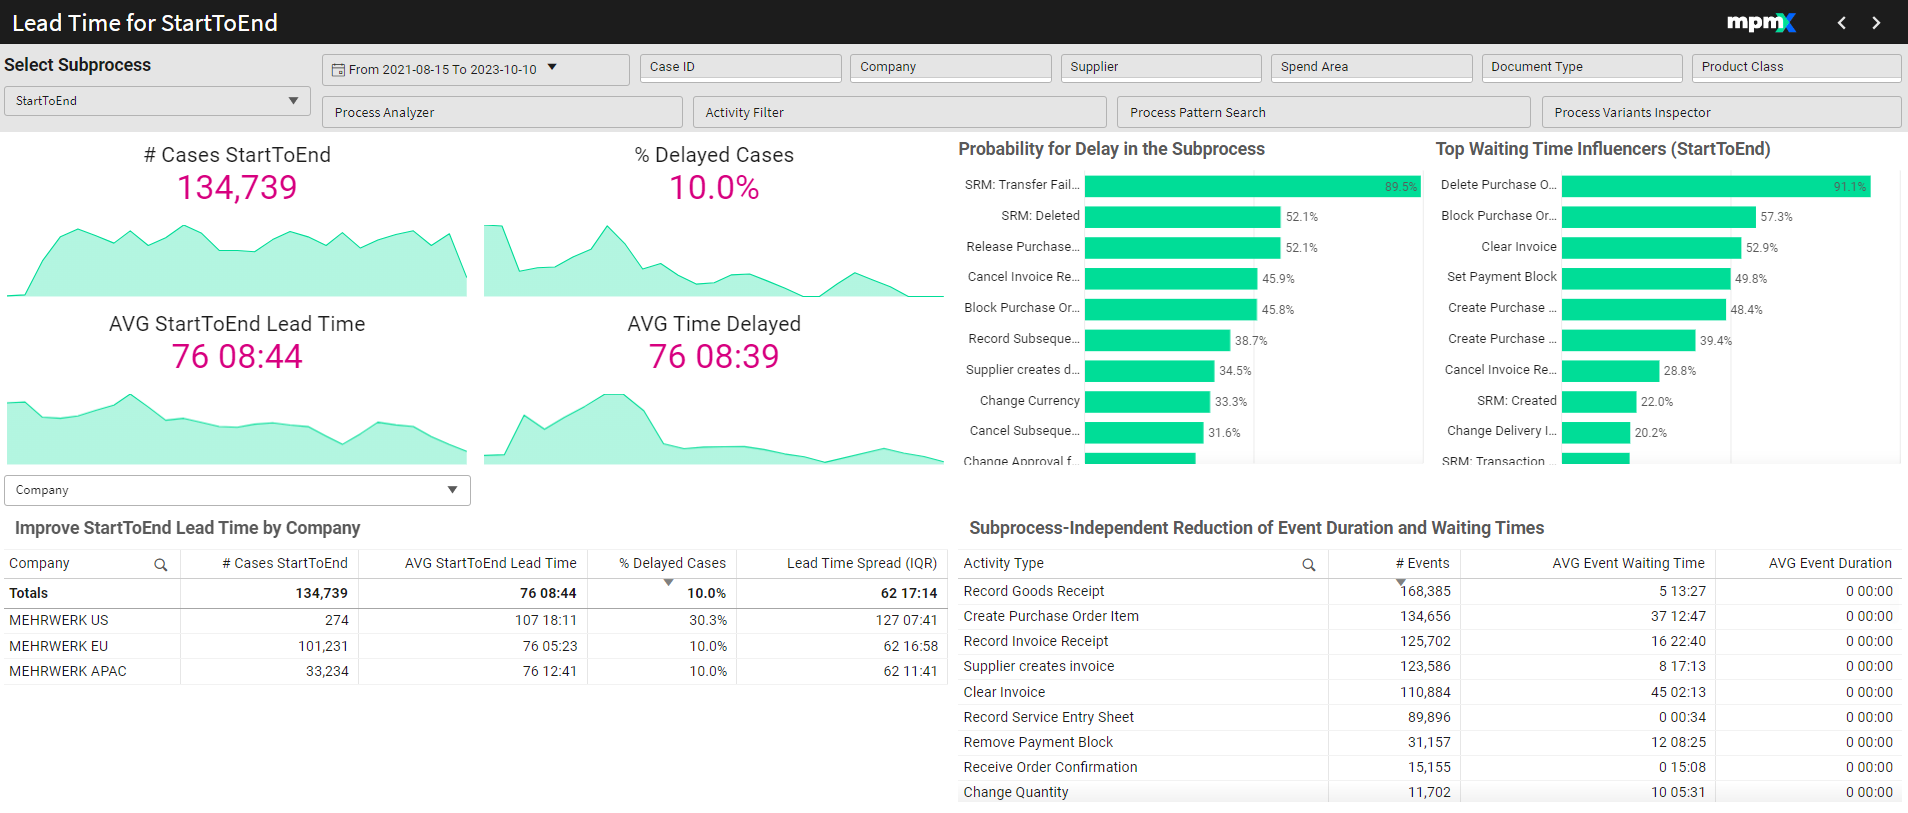
Lead Time for StartToEnd
The Lead Times Worksheet provides insights into the total time required to complete a process, or an in the backend defined set of subprocesses. Users can filter and analyze lead times, delayed cases, and waiting times to identify bottlenecks and inefficiencies. Key visualizations highlight overdue cases, activities contributing to delays, and potential areas for optimization. Interactive tools, such as probability and waiting time bar charts, help pinpoint improvement opportunities. The worksheet supports data-driven decision-making for reducing lead times and improving overall process efficiency.
Lead Time (also called throughput time) is the total time it takes to complete the whole process, from start to finish. It can also be applied to a subprocess or a process step.
Type: Dashboard
StartToEnd refers to the lead time from the Start of the first event of the case until the end of the last event of a case.
Only finished processes are considered in the calculations on the dashboard.
- Late cases and average or median late/overdue times are expressed, based on configuration of target lead times.
- Visualize overdue cases and pinpoint process inefficiencies.
- Identify activities contributing most to delays and waiting times.
- Flexible analysis by any process context to identify lead time improvements
Select a subprocess from the dropdown menu in the top left.
Key Figures
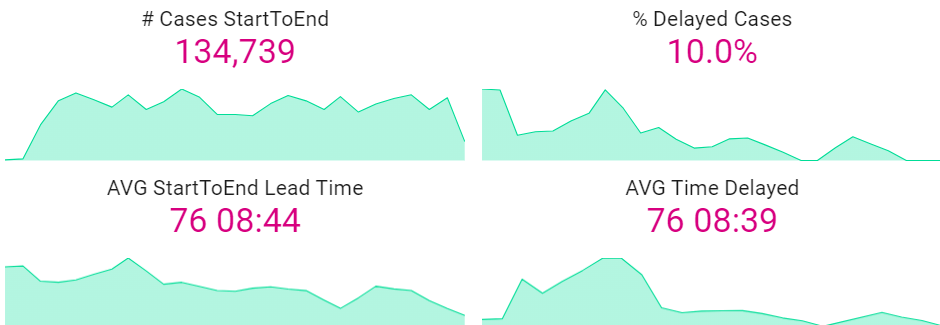
# Cases [Subprocess]
- Displays the number of cases in the selected complete process or subprocess.
- A timeline below the figure tracks how the number of cases has changed over time.
% Delayed Cases
- Represents the percentage of cases that failed to meet their target lead time.
- A low percentage indicates better performance.
AVG [Subprocess] Lead Time
- Shows the average time taken to complete the selected subprocess or process.
- This value should be kept low to ensure efficiency.
AVG Time Delayed
- Displays the average delay for cases in the selected subprocess or process.
- A low value here is desired.
Probability for Delay | Bar Chart
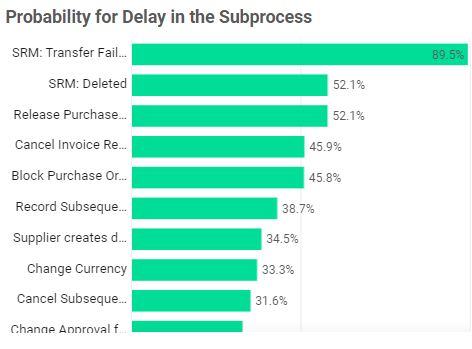
- Highlights activities most commonly associated with delayed cases and their probability.
- Selecting bars will filter the worksheet for those activities, making it easier to pinpoint bottlenecks.
Even if certain activities have a high delay probability, they may not occur often. Focusing on activities that affect a larger number of cases could lead to more impactful optimizations.
Top Waiting Time Influencers | Bar Chart
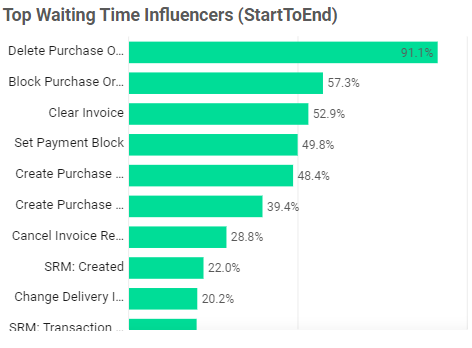
- Identifies the activities with the highest percentage of waiting time in cases.
- If an activity accounts for 80%, that means it represents 80% of the waiting time in cases that include this activity.
Not every case will include all activities.
Improve [Subprocess] Lead Time by [Dimension] | Table
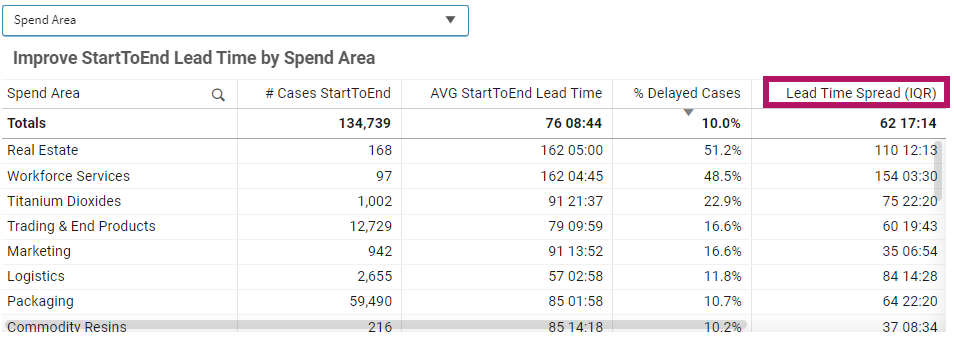
- Displays all relevant metrics (PPIs) in context.
- Select a dimension (e.g., Supplier, Product Class) to see related metrics.
- Apply filters to narrow down and focus on specific areas for improvement.
- Lead Time Spread: Shows the volatility of the lead time among cases by calculating the inner quartile range of the lead time. This means it shows the range between shorter and longer lead times, while excluding the extremely fast and slow cases. This PPI is good to use when the goal it to standardize your lead times. A shorter lead time spread is best.
Subprocess-Independent Reduction of Event Duration and Waiting Times | Table
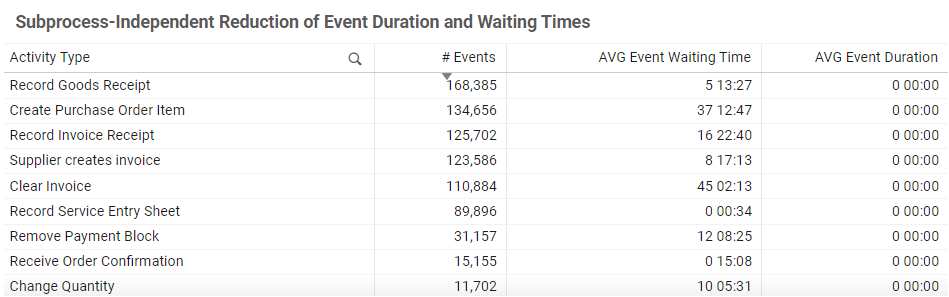
- Lists activities with the number of events and their average waiting time.
- Sort columns to identify activities with the highest frequency or longest waiting times.
- Apply filters to the table to focus on specific activities or metrics.