Resource Analysis
The Resource Analysis Sheet visualizes how resources (e.g. the employee, the team, the machine, etc.) interact with the process by analyzing resource flows across process steps. It highlights handovers between users, helping to detect inefficiencies such as ping-pong effects. Correlations between resource involvement and lead time are made visible, and user workloads over time can be reviewed. This enables identification of bottlenecks, overutilized teams, or uneven workload distribution. Optimizing resource usage leads to more efficient processes, higher employee satisfaction, and improved customer outcomes.
Type: Toolsheet
This sheet replaces the previous toggle function between the User Log and Standard Log in the Process Discovery Sheet by creating a separate sheet for the User Log.
If your resources are users, the sheet could also be named User Analysis. If you analyze the usage of machines you could have a Machine Analysis Sheet for example.
Key Figures
Distinct Resource
- measures the count of unique resources, such as employees, tools, or materials, involved in a process
AVG % of Resource Changes per Case
-
shows the average percentage of times resources are reassigned within each case.
-
This number reflects the stability and consistency of resources.
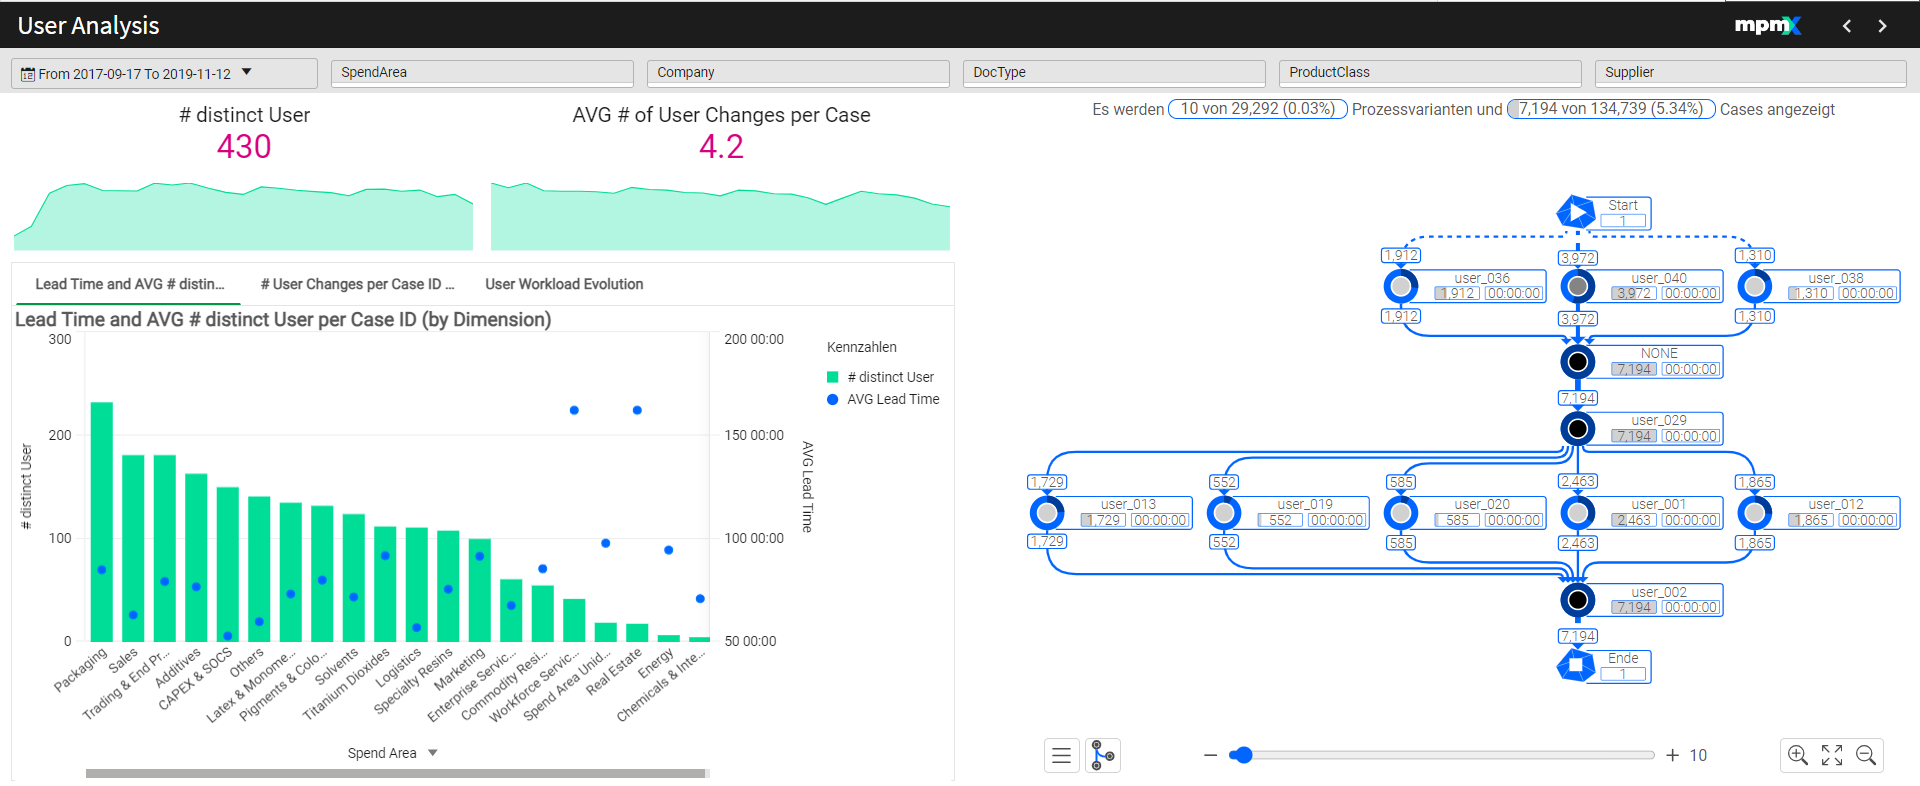
Process Analyzer
- For this sheet, the Process Analyzer shows not the Activities as usual but the flow between the resources i.e. from which user to which user is the case or the order passed.
The Charts
Lead Time and AVG # distinct Resource per Case ID (by Dimension)
This charts provides information about the number of distinct users/resources and the lead time per case dimension. It shows the relation between how many users are involved in a case and how this influences the lead time.
# User/Resource changes per case ID segmented in Classes
If you switch to the next tab, you can see the overall Resource Changes per CaseID segmented in Classes. It provides information about how many users or resource changes per case there are. The more users are involved the higher the lead time gets.
This can be helpful for identifying cases and causes for a lot of user changes and with that information reduce lead time effectively.
User/Resource Workload Evolution
The third tab shows a Graph of the Resource Workload Evolution. Here you can see which Resource (User) had how much workload over time. This can be helpful to monitor the usage of resources and act accordingly i.e. who is maybe overutilized or has a specific trend in terms of workload.