Optimization Dashboard
The Optimization Dashboard offers insights into process effectiveness and efficiency, helping identify cost-saving opportunities and trends. The sheet allows for timeframe selection, key figure analysis, and links to detailed worksheets for deeper insights. Users can analyze key metrics — case volume, automation rate, lead time, rework rates and process variants. By visualizing trends, it enables data-driven process improvements.
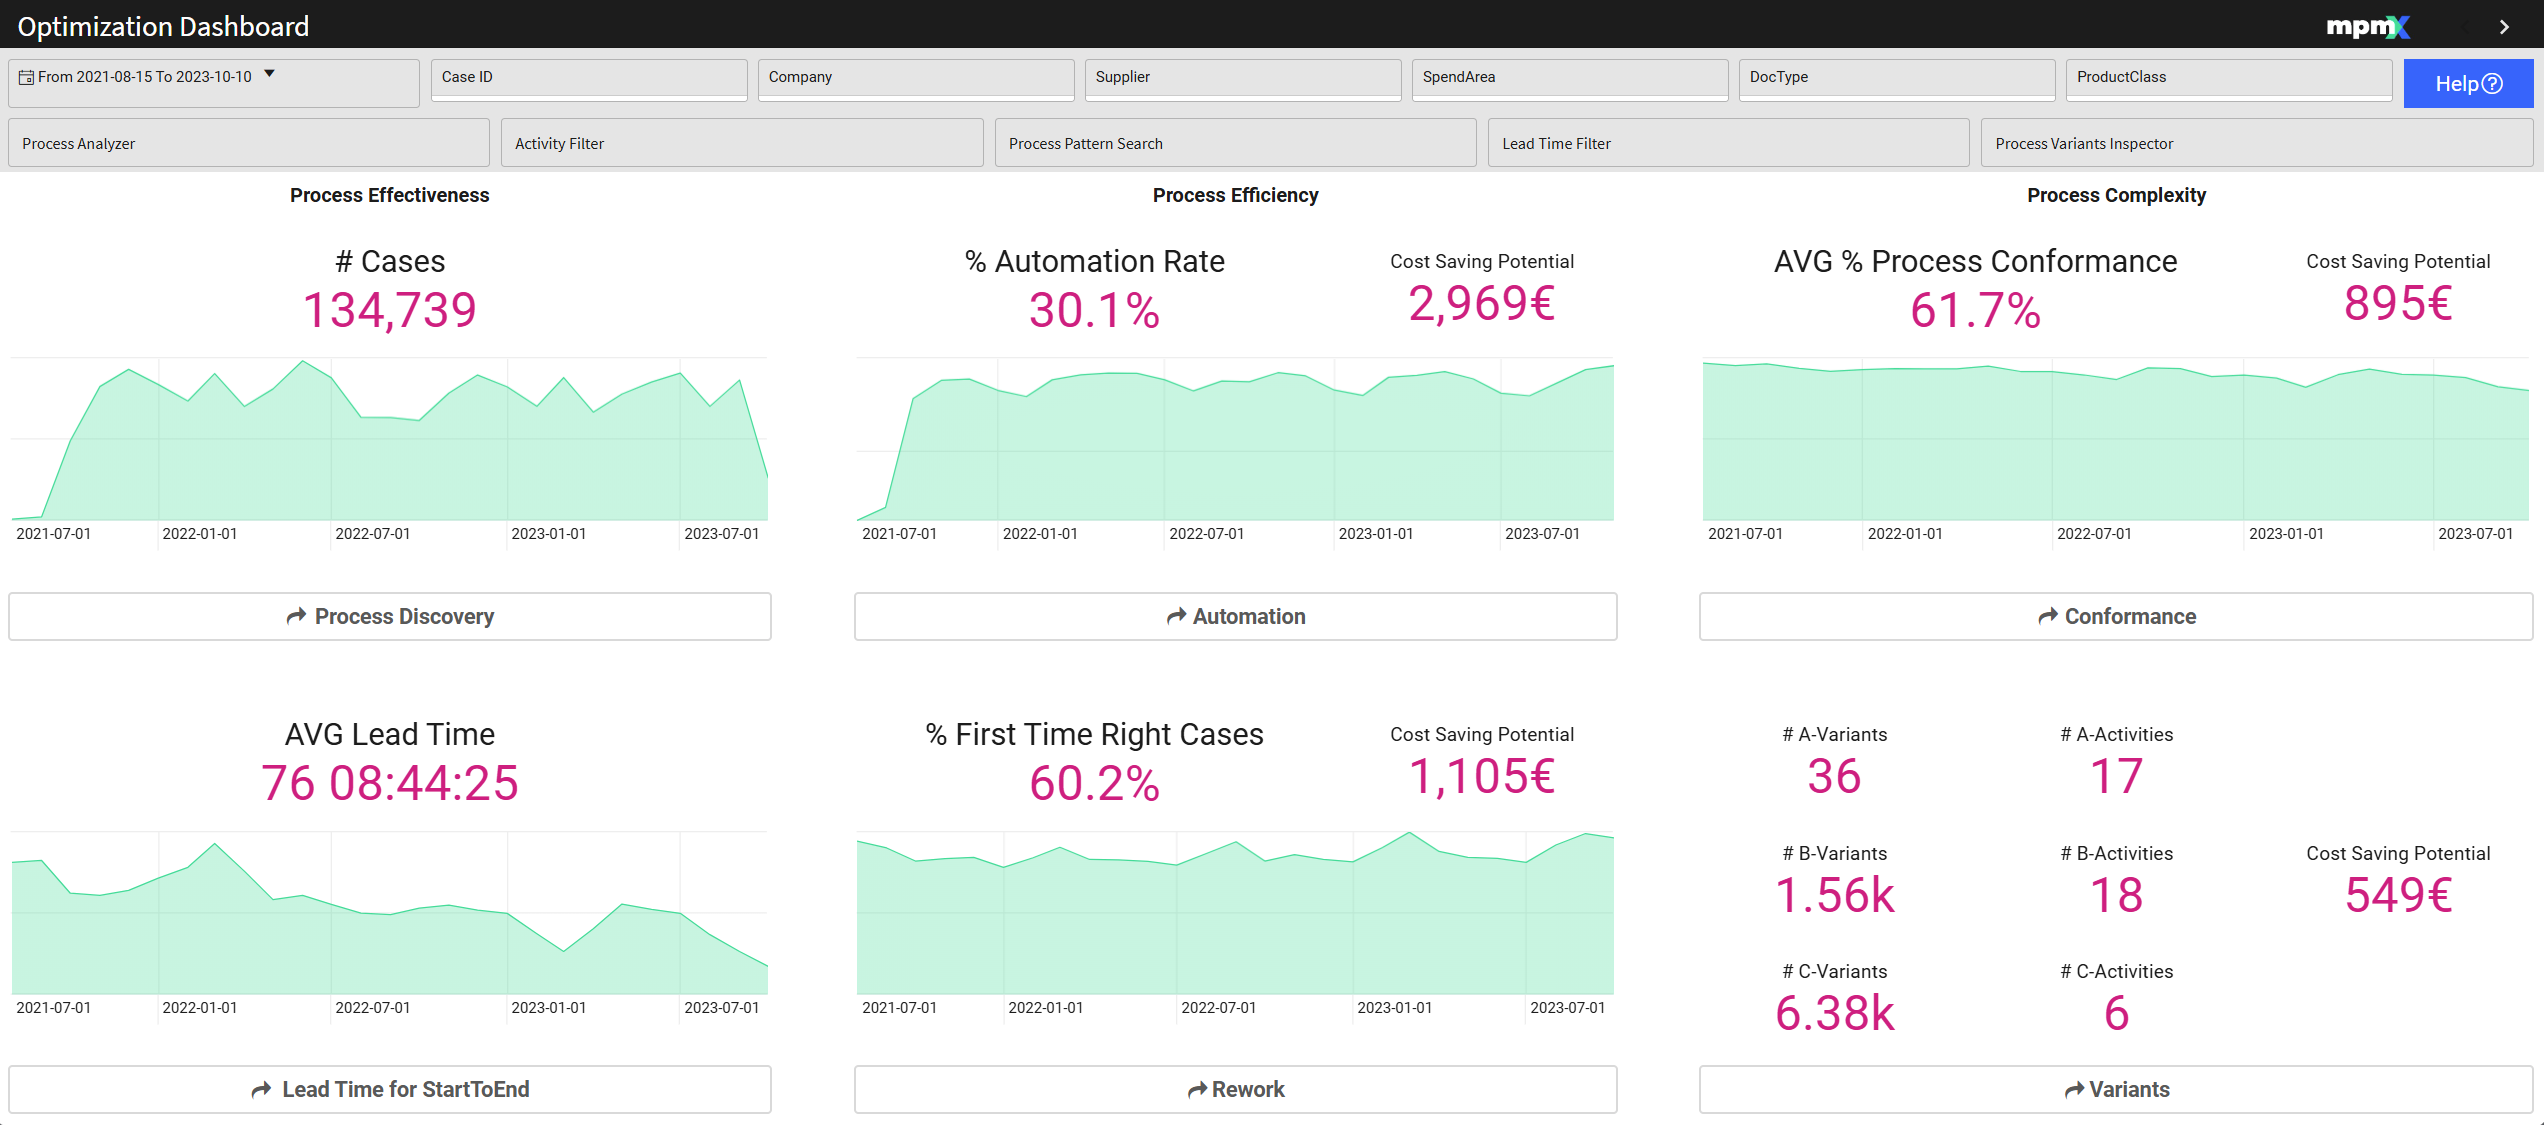
At the top left of the worksheet a specific timeframe can be selected by choosing a start and end date.
Each key figure represents a potential time or cost-saving opportunity across the entire process. Use the filter options to refine your analysis.
Each section has a button that will take you to the corresponding sheet, which provides a more in depth analysis.
Process Effectiveness
Process Discovery
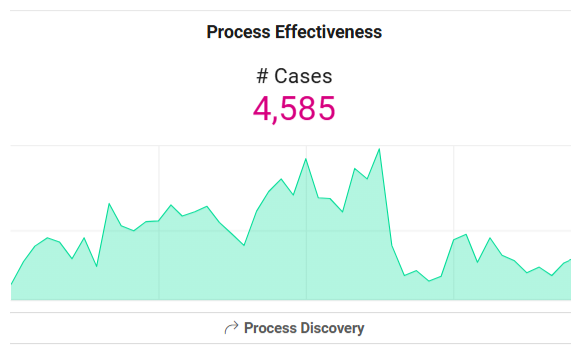
- # Cases Displays the number of cases processed through a specific workflow.
- Higher case volume generally indicates a more effective process.
- The timeline below illustrates case volume trends over time.
Lead Times
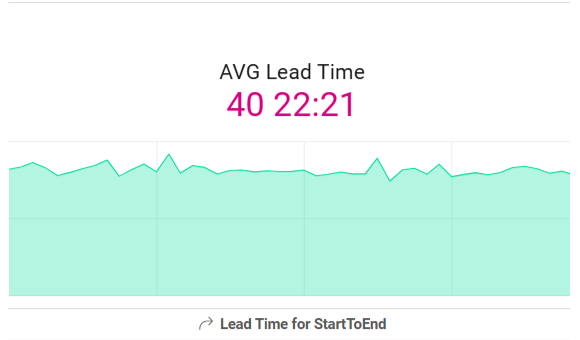
- AVG Lead Time – Represents the average time required to complete the entire process.
- A lower value signifies a faster, more efficient process.
Process Efficiency
Automation
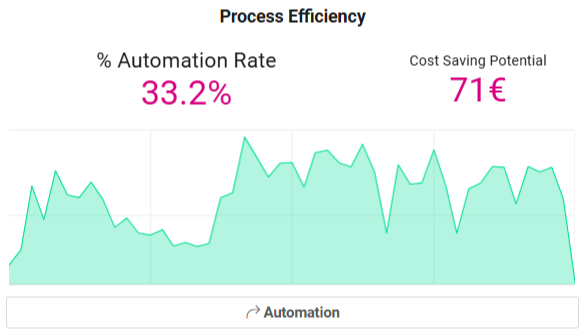
- % Automation Rate - Indicates the percentage of automated steps within the process.
- A higher automation rate generally leads to greater efficiency.
- Cost Saving Potential - Displaying the Cost Saving Potential that could be achieved by automating more process steps.
Rework
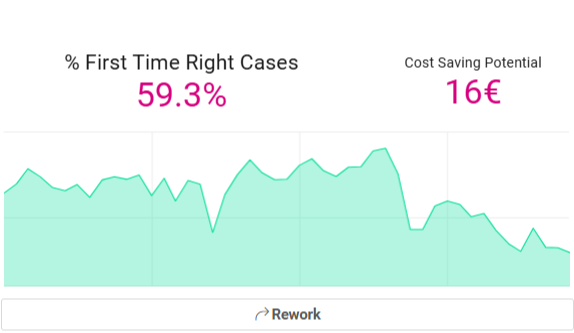
- % First Time Right Cases – Shows the percentage of cases completed without rework in any activity.
- A higher percentage is desirable, indicating fewer errors and inefficiencies.
- A timeline visualization helps to track trends over time.
- Cost Saving Potential – Displays the Cost Saving Potential that can be achieved by eliminating rework cases.
Process Complexity
Conformance
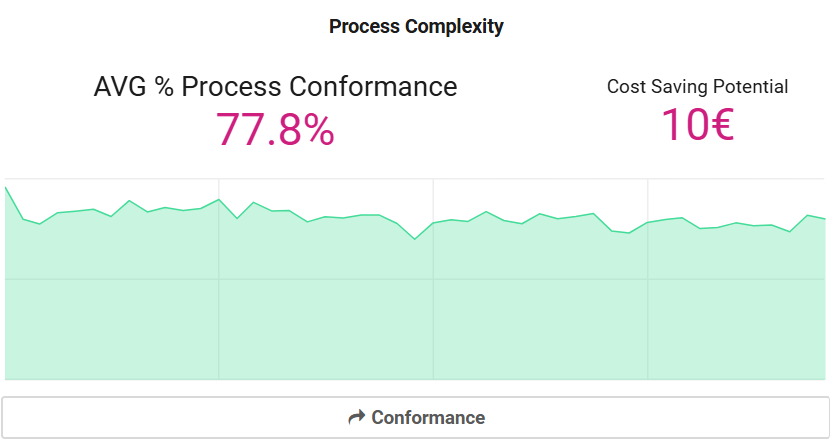
- AVG % Process Conformance – Shows the percentage of cases in this process that are conform to the process model.
- Cost Saving Potential – Displays the Cost Saving Potential that can be achieved by eliminating deviations.
Variants
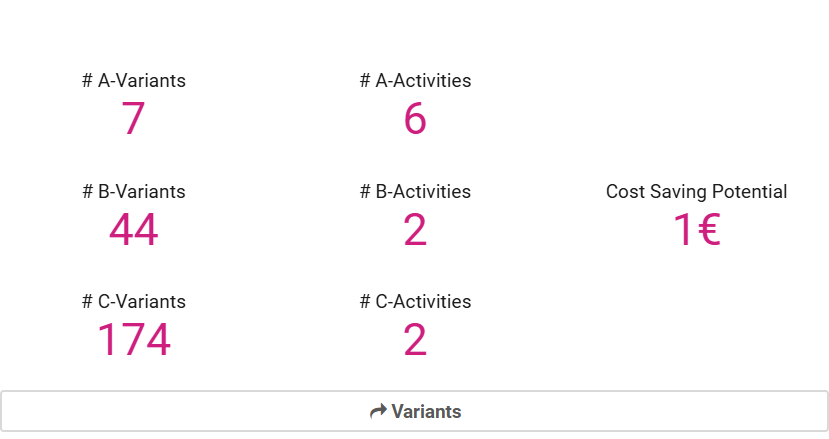
Displays A-, B-Variants and C-Variants, along with their number of activities, as well as the Cost-Saving Potential that can be achieved by omitting these variants.
- A-Variants (80%) – The most common process variants, covering 80% of all cases.
- B-Variants (15%) – Variants covering the next 15% (80-95% of cases).
- C-Variants (5%) – The least common variants, covering the last 5% of cases.
- A high number of B and C variants indicates a complex process.