Rework
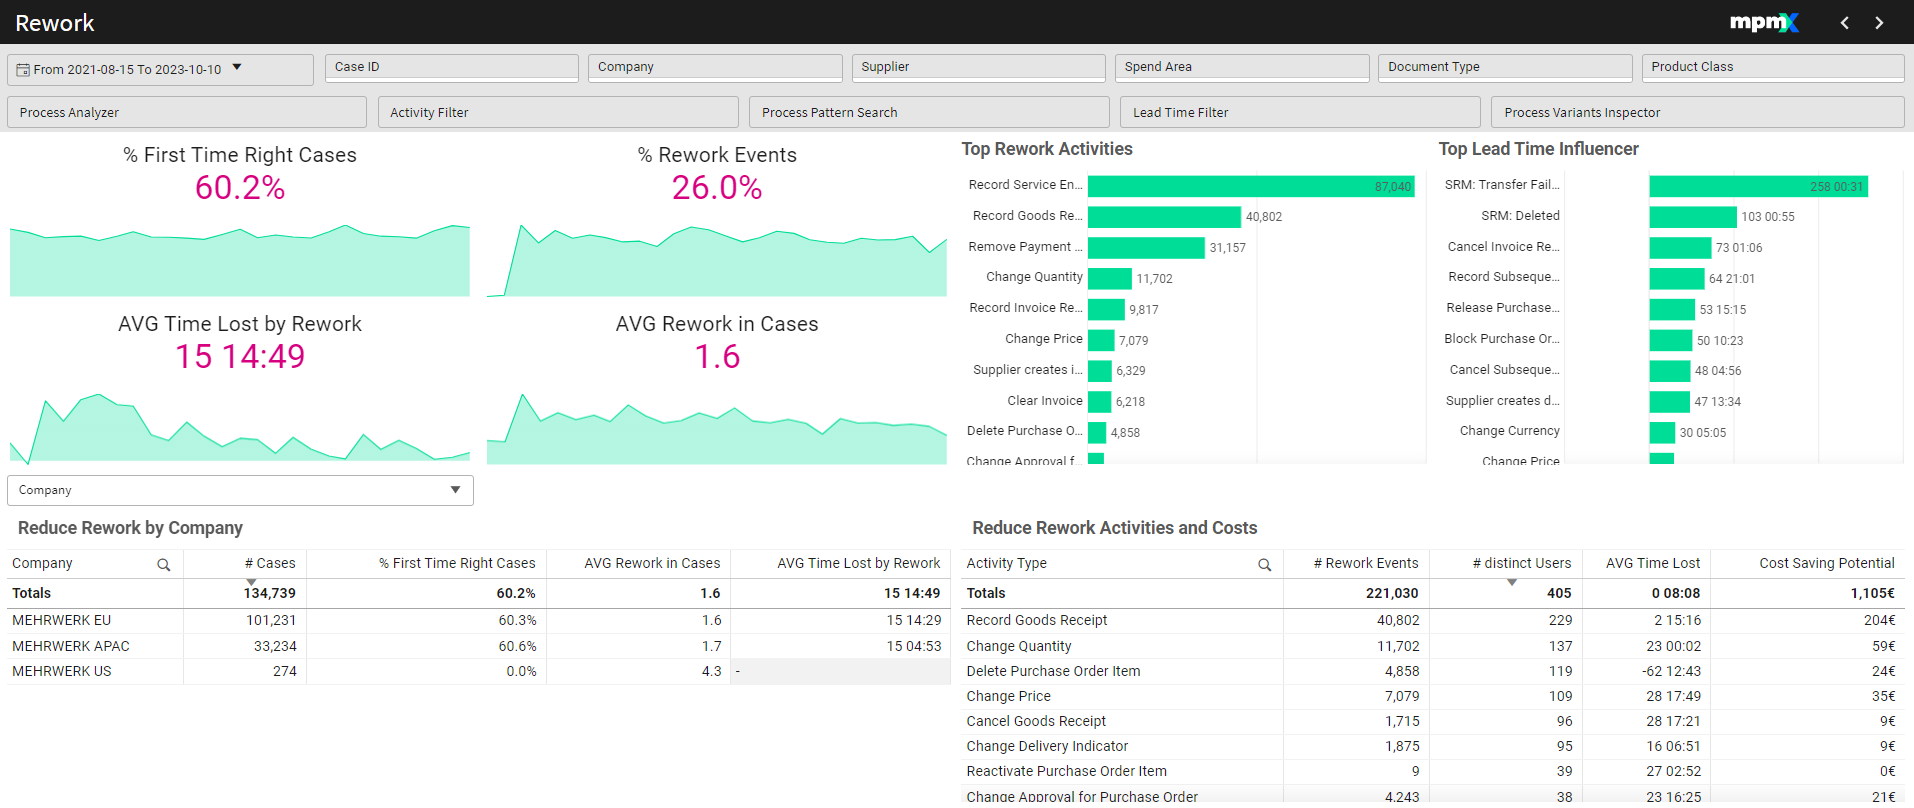
Rework is one of the biggest drivers of process cost. It can occur in production or in operational processes.
Rework drives up lead times (makes the process longer) and could create problems for others further down the process, including colleagues, suppliers or customers.
Functions
-
Analyze process performance indicators related to rework such as rework rates, cases without rework or the time lost due to rework
-
Detect and quantify the most common reworks and their impact on the lead time
-
Flexible Analysis by any given process context to validate most effective rework-reduction measures
Business Benefits
-
Overview and monitoring of the current automation level
-
Detect process steps that save the most resources when automated
-
Calculation of potential rework avoidance savings
Interpreting the Visualizations
Key Figures
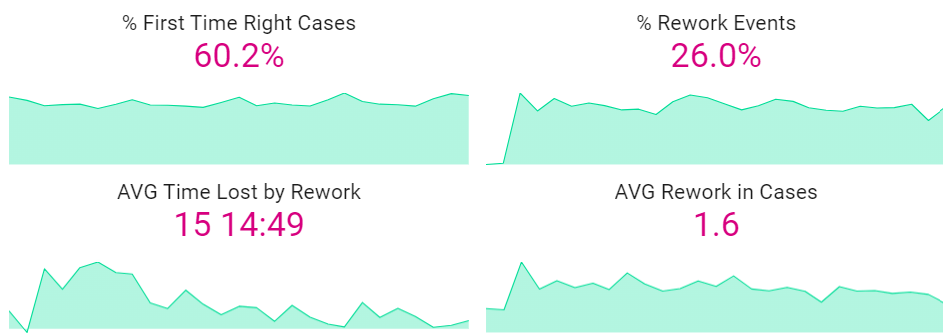
% First Time Right Cases
- Shows the percentage of cases without rework in any activity.
- This number should be high.
- A timeline below the PPIs show the trend over time.
% Rework Events
- How many events in the process are rework (e.g. changes, adjustments, deletions, or cancellations)
- This PPI should be low.
AVG Time Lost by Rework
- Shows the negative impact rework activities have on your process.
- This PPI should be low.
AVG Rework in Cases
- Shows the average number of rework events per case.
- This number should be low.
Top Rework Activities Bar Chart
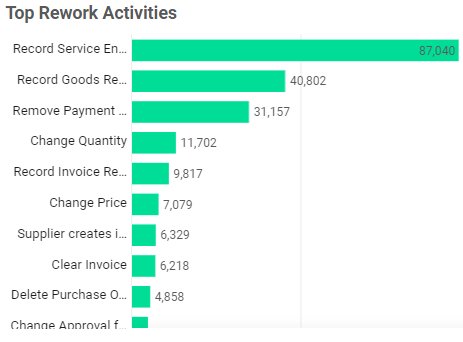
Shows the rework activities that occur most often in the process.
Select one or more bars in this chart to filter further.
Top Lead Time Influencer Bar Chart
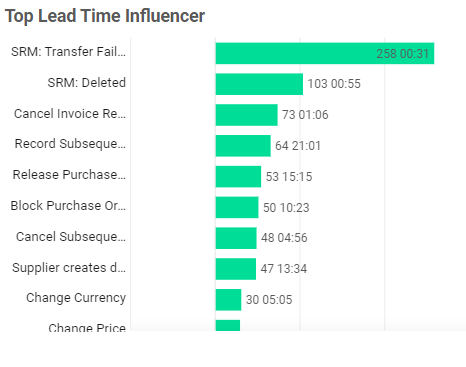
As with all the toolsheets, something that has a big effect, but only on a small number of cases may not make a big change overall, while something that has a smaller effect but applies to many cases will add up to a bigger impact.
Reduce Rework By (Dimension) Table
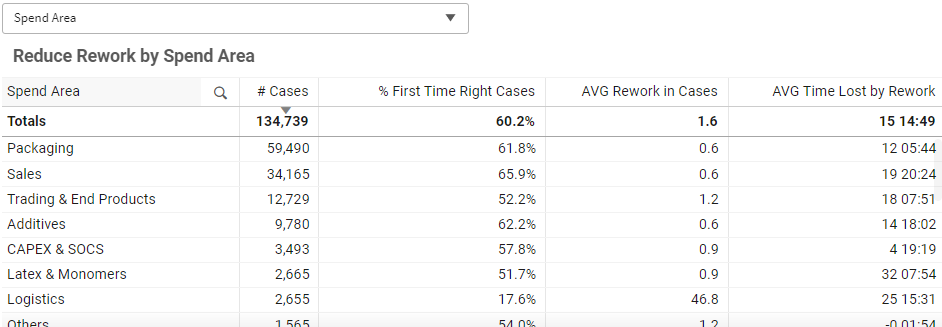
Select within the table to filter further.
Reduce Rework Activities and Costs Table
