Optimization Dashboard

Functions
-
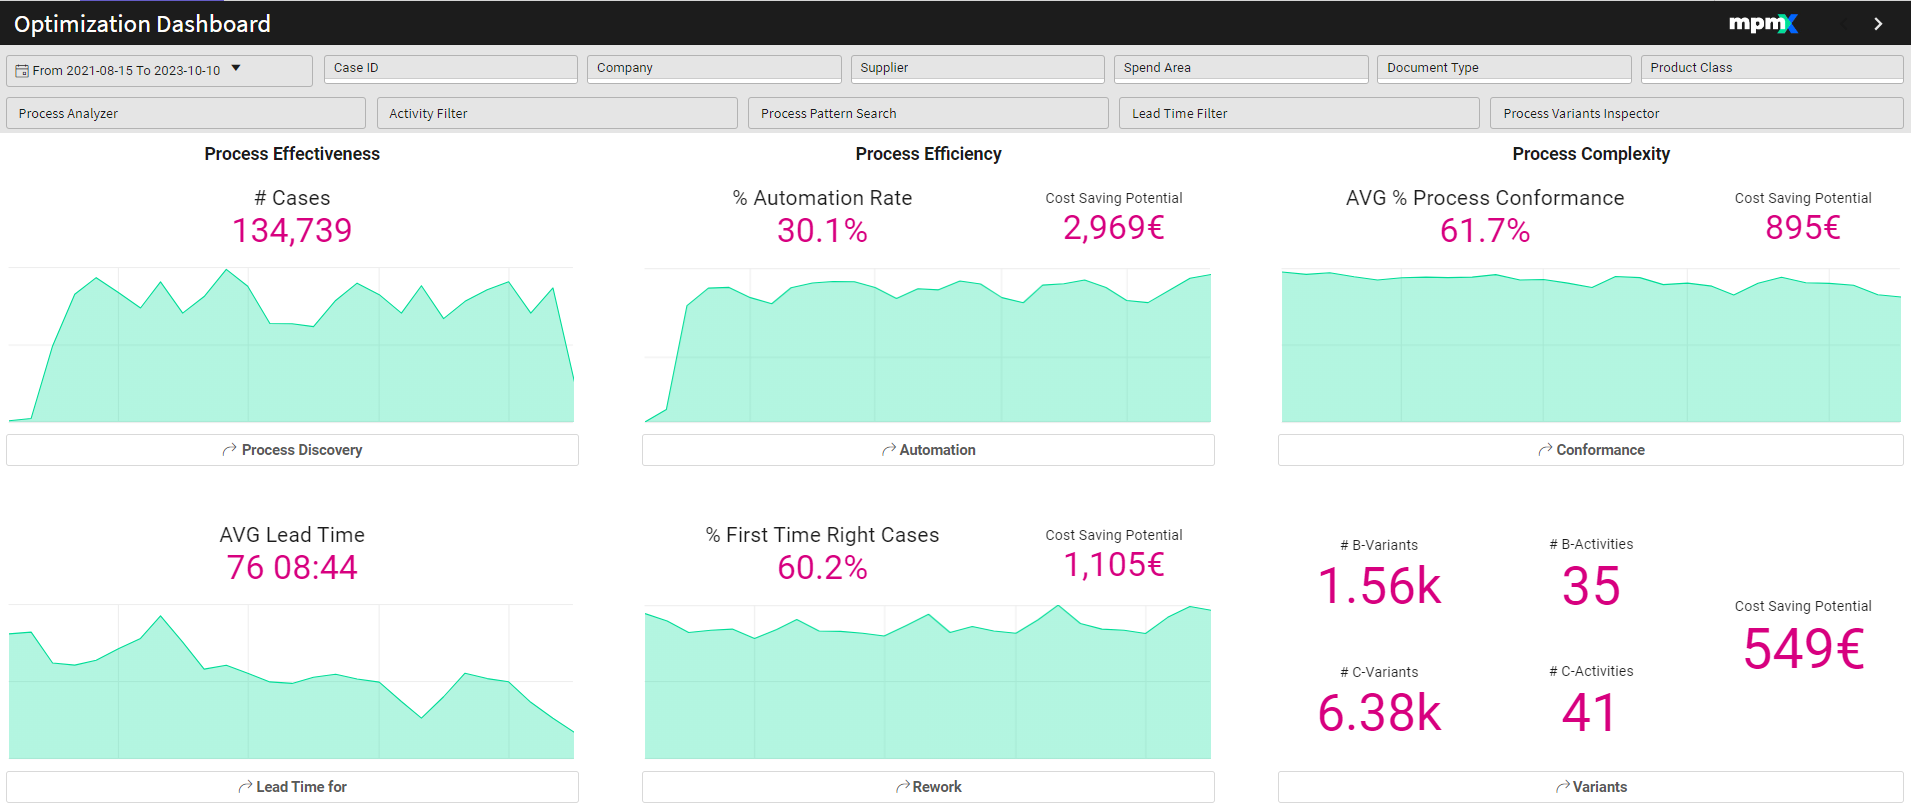
See all three areas of optimization at one glance: Effectiveness, Efficiency, and Complexity
-
Period comparison to see trend for important process performance indicators
-
Saving potentials calculation per optimization area based on cost, number and improvement potential per event
Business Benefits
-
Management view to quickly identify optimization & saving potentials
-
Check on trends in the process to intervene quickly on dropping process performance indicators
Interpreting the Visualizations
Key Figures
Each of the key figures has a time or cost saving potential associated with it. They reflect the complete process. Use the filter options to narrow your focus.
💡 Note: Each of the sections have a button to take you to the corresponding sheet that provides a deeper analysis.
Process Discovery
# Cases
- How many cases are going through this particular process.
- The more cases that can be processed, the more effective the process is.
- The timeline underneaths shows the development over time.
AVG Lead Time
- The amount of time it takes on average to complete the whole process.
- The lower this number, the quicker the process gets completed.
Process Efficiency
% Automation Rate
- The automation rate indicates the percent of ...
- The higher the automation rate, the more efficient your process runs.
% First Time Right Cases (Rework)
- Shows the percentage of cases without rework in any activity.
- This number should be high.
- A timeline below the PPIs show the trend over time.
Process Complexity
AVG % Process Conformance
Improve Process Conformance and Reduce Deviations
- The percentage of cases in this process that conform to the process model.
- This number should be high.
Variants
- B-Variants & C-Variants and their number of activities.
- A-variants are the most common process variants that make up 80 percent of all cases.
- B-variants are those variants that cover the next 15% of cases
- The last 5% of cases are covered by the C-variants